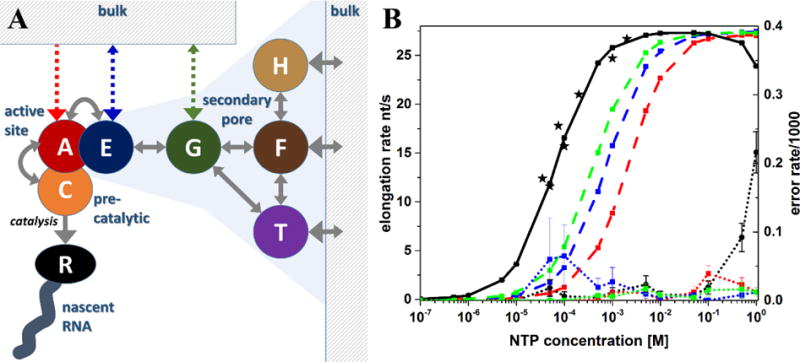
Figure 3. Kinetic network model and predicted elongation and misincorporation rates.

Kinetic network model capturing NTP entry and RNA elongation with the main model represented by solid gray lines and alternate, hypothetical NTP entry pathways indicated as dashed lines (A). Elongation (black solid line and colored dashed lines; left scale) and misincorporation (dotted lines; right scale) rates as a function of bulk NTP concentration predicted from kinetic model. Black lines show results for full kinetic network model. Red, blue, and green lines correspond to alternative models where NTPs directly enter A, E, or G sites, respectively. Experimental pause-free elongation rates from single-molecule study of Pol II [40] are shown as black stars (B).
