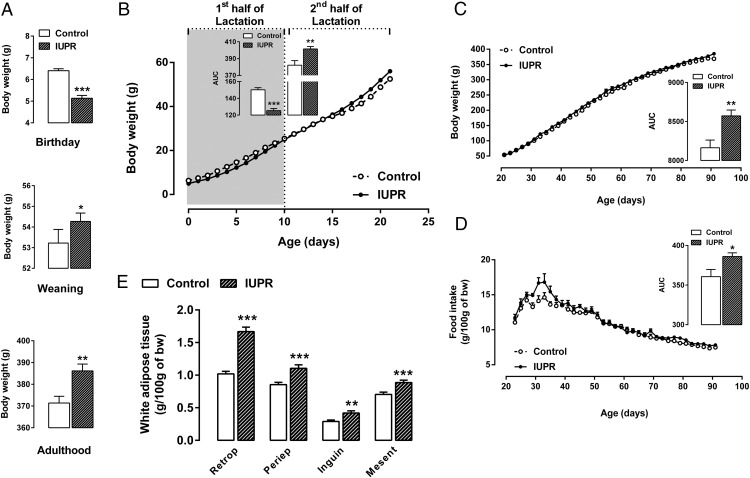
Figure 1. Body weights at birth, weaning and at adulthood (A), the bw evolution throughout lactation (B) and from weaning until adulthood (C), food intake levels from weaning until adulthood (D), and white adipose tissue weights at adulthood (E) are shown.
The data are expressed as the means ± SEM and were obtained from 30 rats (A–C), 20 rats (E) or five experimental group litters (D). The inserts on the left (B) and right (C and D) panels provide the AUC values, which were calculated from the first or the second half of the bw curve (B), from the entire bw curve (C) or from the food intake data (D). All the differences were analyzed with Student t tests, where *, P < .05; **, P < .01; ***, P < .001; and ns denoted samples were not significantly different. Abbreviations: Retrop, retroperitoneal fat; Periep, Periepididymal fat; Inguin, inguinal fat; and Mesent, mesenteric fat.

