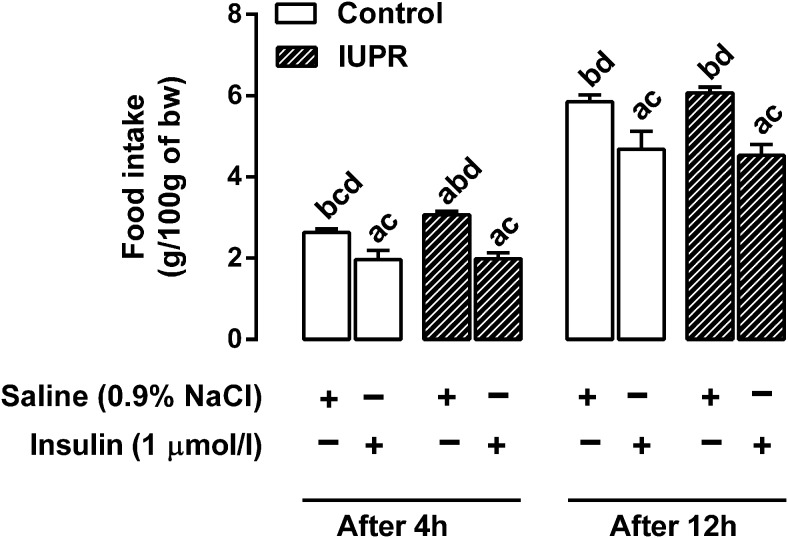
Figure 2. Ad libitum food intake in 12 h fasted (0700–1900 h) rats, 4 h (at 2300 h) and 12 h (at 0700 h) after saline or insulin icv injection.
The data are expressed as the means ± SEM of six rats from each experimental group and analyzed with one-way ANOVA, followed by the Bonferroni test for each batch of data separately (at 4 and 12 h after the icv injection). The letters on the bars denote significant differences between the groups (P < .05). A, Controls treated with saline, B, controls treated with insulin; C, IUPR treated with saline; and D, IUPR treated with insulin.

