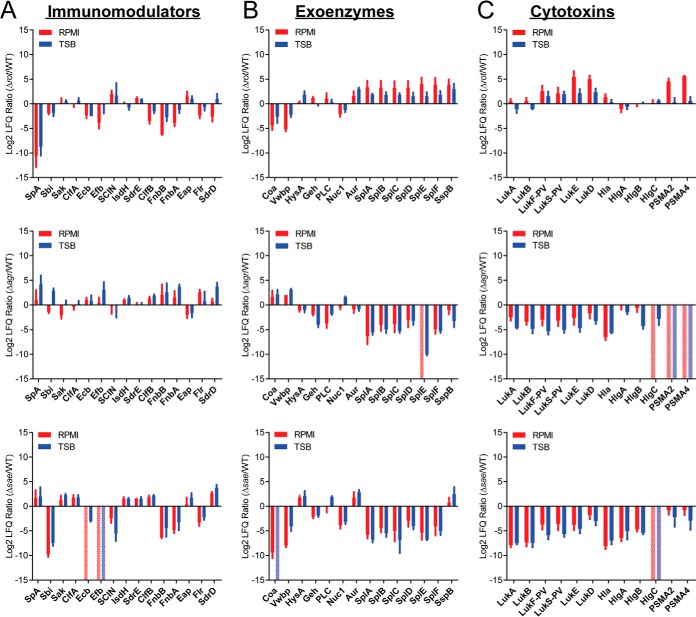
Fig. 2.
The effect of nutrient availability on the exoproteome of Sa master regulator mutants as investigated through the analysis of the levels of secretion of three major classes of virulence factors. The log2 ratio of protein LFQ values from the mutant versus LAC WT are plotted for (A) immunomodulators, (B) exoenzymes, and (C) cytotoxins. Minimal medium (RPMI) values are in red and nutrient rich medium (TSB) are in blue. A positive value indicates the protein is detected at a higher intensity in the mutant than in the LAC WT. A negative value indicates the protein is detected at a higher intensity in the LAC WT than the mutant. All proteins are labeled with the corresponding common protein identifier. Error bars represent the standard deviation of the triplicate analyses. If a protein is only identified in the LAC WT samples the value is set to the minimum of the axis (-15) and if a protein is only identified in the mutant the value is set to the maximum of the axis (+15) and represented by a pale, dotted bar.

