Fig. 3.
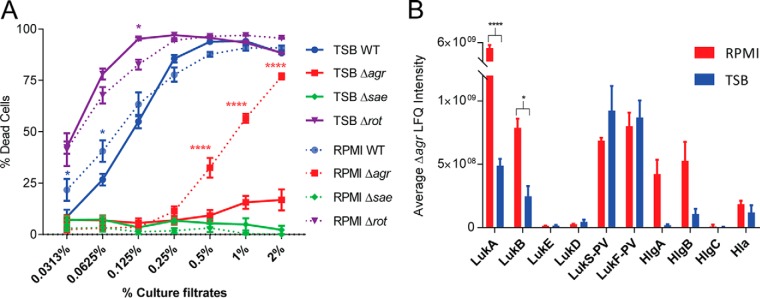
The effect of nutrient availability on the cytotoxicity of mutant Sa. A, Cytotoxicity assay data is plotted for LAC WT and each mutant, where a higher percent of dead cells (hPMNs) indicates greater cytotoxicity. Intoxication of hPMNs from six donors ± the standard error of mean with titration of culture filtrates from the indicated Sa LAC strains grown in rich (TSB) or minimal media (RPMI). Cell death was measured with CellTiter metabolic dye. The culture filtrate from Δagr grown in minimal medium has a cytotoxicity closer to LAC WT, but grown in rich medium the cytotoxicity is drastically reduced. A two-way ANOVA was performed comparing means using Sidak correction for multiple comparisons. Data points with p values less than 0.05 are considered significant and are indicated by the following key: 0.01–0.05 = *, 0.01–0.001 = **, 0.001–0.0001 = ***, and <0.0001 = ****. B, The average LFQ intensity values for the selected cytotoxins are plotted with minimal medium in red and rich medium in blue. Error bars represent the standard deviation of the triplicate analyses. All proteins are labeled with the corresponding protein ID. The intensity of the monomers of the bi-component leukocidin LukAB from Δagr grown in minimal medium is significantly higher than that grown in rich medium. A two-way ANOVA was performed as described above.

