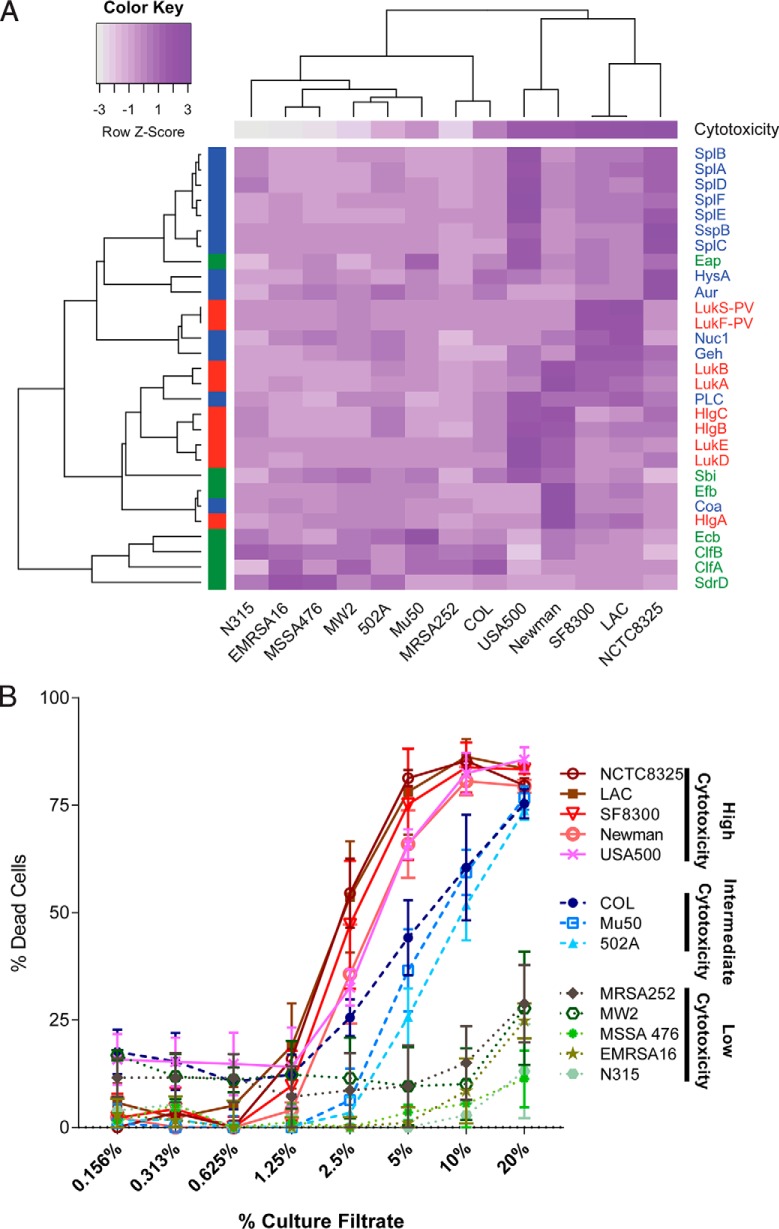
Fig. 7.
The effect of clonal lineages on the exoprotein production by a group of diverse Sa reference strains. A, Heat map of protein quantitation data for the selected virulence factors. The color scheme represents a row-based z-score on a scale from dark purple (most PSMs) to white (fewest PSMs). The protein class is designated by color on the left y axis and the common protein IDs are labeled on the right y axis. Immunomodulators are indicated in green, exoenzymes in blue, and cytotoxins in red. The strain names are indicated along the bottom x axis. The average cytotoxicity using the 5% dilution of the culture filtrate is shown for each strain at the top of the heat map. The same color scheme is used as for the protein data (i.e. the cytotoxicity data was also transformed to z-scores; dark purple (most cytotoxic) to white (least cytotoxic)). The expression of orthologues was compared across the reference strains using LAC as the pivot-strain. The reciprocal best blast hits for every selected virulence factor in each reference strain were determined, peptide intensities for all ortho-conserved and ortho-unique PSMs were summed, results were log10 transformed and z-scores were calculated. The resulting data was clustered using complete linkage agglomerative clustering and 1-r as the distance measure, where r is defined as the Pearson correlation. B, The cytotoxicities of all 13 reference strains is plotted. A higher percent of dead cells (hPMNs) indicates greater cytotoxicity. Intoxication of hPMNs (from three donors ± the standard error of mean) with a titration of culture filtrates from the reference strains. Cell death was measured with CellTiter metabolic dye. The CC8 strains are the most cytotoxic strains, CC5 strains are moderately cytotoxic, and the CC1 and CC30 strains have low cytotoxicity.

