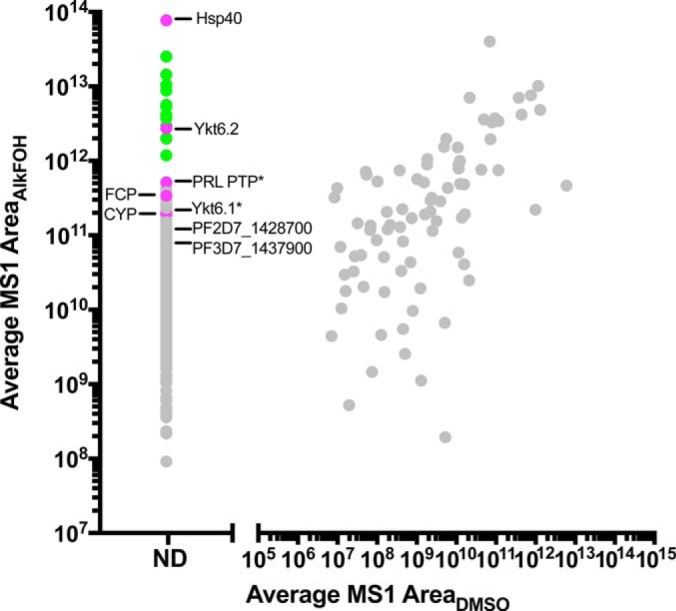
Fig. 2.

Proteomic identification of prenylated proteins in P. falciparum reveals a limited number of substrates. Average MS1 area measured in AlkFOH-labeled samples is plotted against average MS1 area measured for the same protein in DMSO mock-treated samples. Proteins which were detected only in AlkFOH labeled samples are shown on the left of the graph (ND = not detected). All data points are shown. Rab GTPases are marked in green, whereas proteins with a C-terminal CaaX box are shown in magenta. CaaX proteins which have previously been shown to be prenylated are designated with an asterisk. Results are based on five biological replicates.
