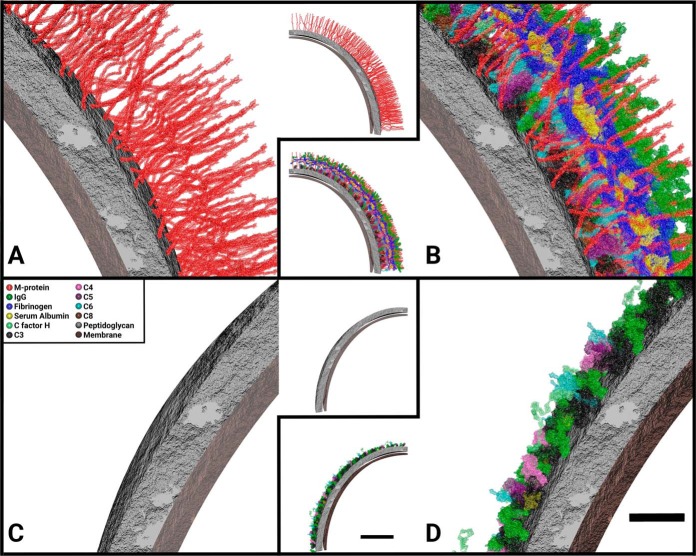
Fig. 4.
Molecular anatomy of bacterial surfaces using SRM data. Appearance of the stoichiometric surface density models of S. pyogenes with or without plasma proteins adsorbed to the surface: A, The wild-type strain SF370; B, SF370 with plasma adsorbed to surface; C, The SF370 M1-deletion mutant ΔM1; D, ΔM1 with plasma adsorbed to surface. A 1/32 piece of the surface, 30800 nm2, 3% of total bacterial area, is represented in the figures (inserts). In order to visualize the 3D image a close-up figure for each of the inserts is provided, depicting a smaller part of the image. A legend with the colors of the visualized proteins can be found in C and is consistent throughout the other panels. Scale bars, 20 nm (close-ups) and 100 nm (inserts).

