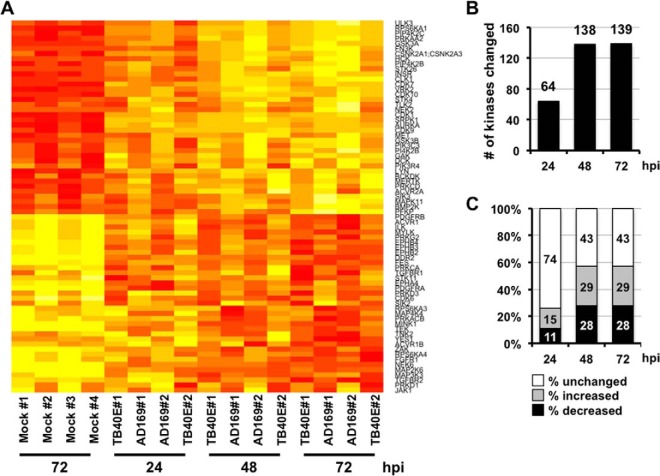
Fig. 2.
Host kinome changes quantified over a time course of HCMV infection. A, Heat map showing the quantified kinases significantly altered during HCMV infection. Fibroblasts were infected with AD169 or TB40E at a multiplicity of one, and cellular kinases were identified and quantified by MIB-MS kinome profiling. The heat map shows the change in kinase quantification for kinases significantly altered at multiple times after infection. B, Graph showing the number of cellular kinases significantly changed at each time after HCMV infection as quantified by MIBS-MS as compared with the uninfected sample. C, Percentage of kinases (of 244 total) at each time point with a significant increase, decrease, or no change in recovery with MIB-MS after HCMV infection.

