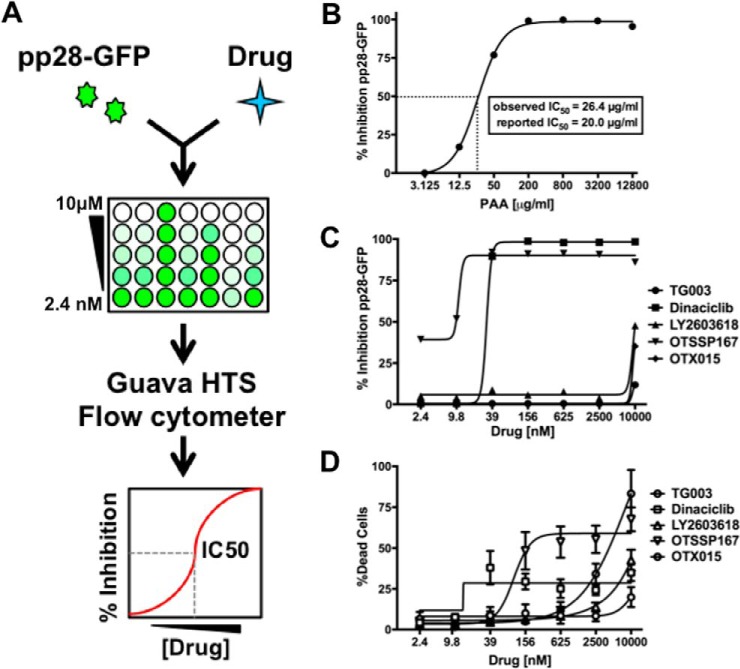
Fig. 4.
Analysis of potential HCMV antivirals. A, Schematic of method. Fibroblasts were treated with infected with pp28-GFP at an MOI of 1 in a 96-well plate format. Cells were treated with seven concentrations of each drug ranging from 10 μm to 2.4 nm at the time of infection. Cells were harvested at 96 h after infection, and the GFP fluorescence of each well was determined using a Guava HTS flow cytometer. The change in GFP fluorescence at each dose of drug was used to calculate the 50% inhibitory concentration (IC50). B, Fibroblasts were infected as in A, and treated with a range of concentrations of PAA, a well-characterized inhibitor of viral DNA replication. The IC50 was determined as in A. The observed IC50 value and previously reported IC50 are shown. C, Graph showing the IC50 data for drugs that significantly inhibited pp28-GFP fluorescence. D, The dose of each drug that resulted in 50% cell death (LD50) was determined using the LDH release assay. Toxicity data is shown for drugs that inhibit pp28-GFP fluorescence. TG003 is included in graphs C and D as an example of a drug with no effect on pp28-GFP fluorescence or cell viability. The graphs show the mean and standard deviation of at least two experiments.

