
Fig. 3.
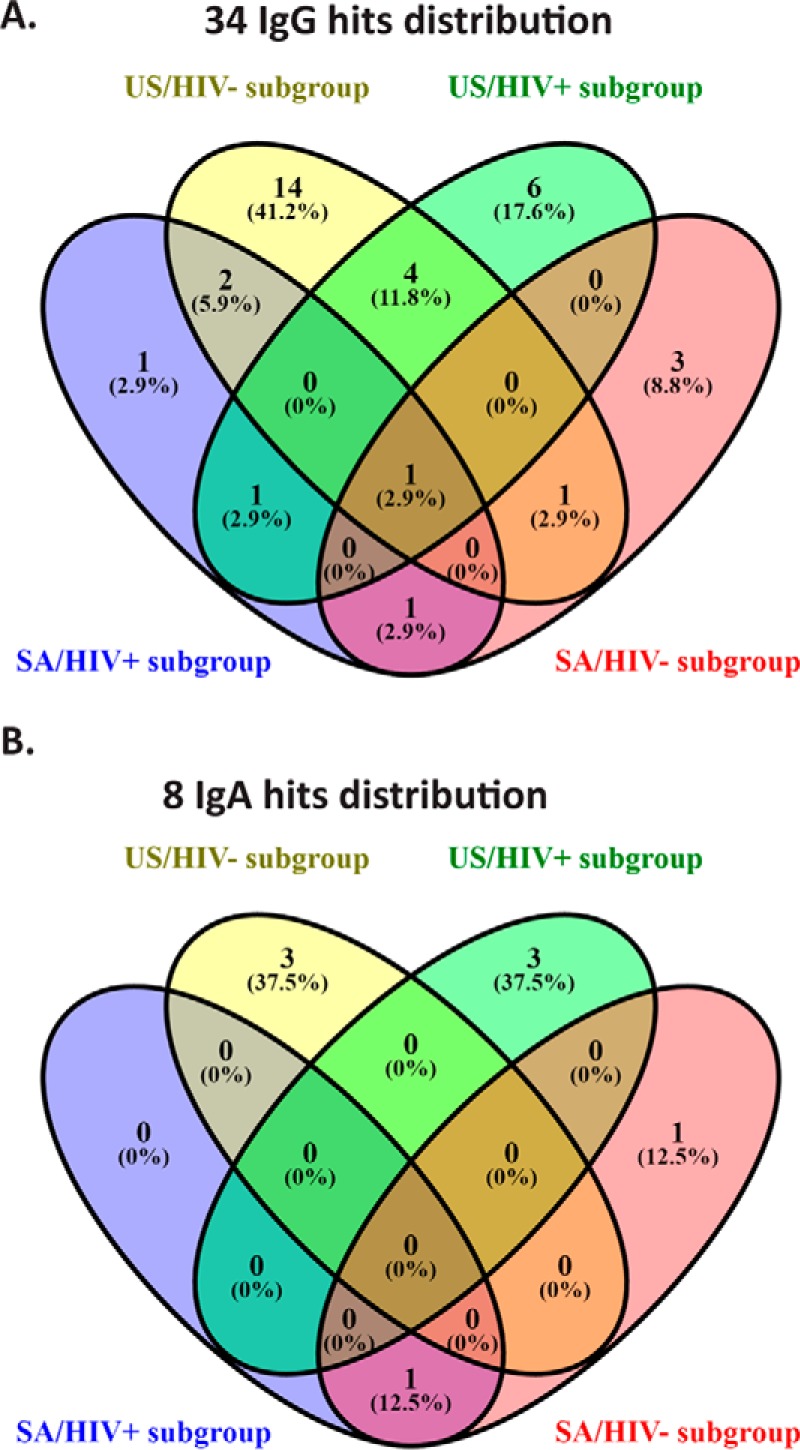
Validated IgG and IgA hits presented as a Venn Diagram distribution across the four subgroups. A, Venn Diagram of >20% sensitivity IgG hits. B, Venn Diagram of >20% sensitivity IgA hits.
Official websites use .gov
A
.gov website belongs to an official
government organization in the United States.
Secure .gov websites use HTTPS
A lock (
) or https:// means you've safely
connected to the .gov website. Share sensitive
information only on official, secure websites.
Validated IgG and IgA hits presented as a Venn Diagram distribution across the four subgroups. A, Venn Diagram of >20% sensitivity IgG hits. B, Venn Diagram of >20% sensitivity IgA hits.