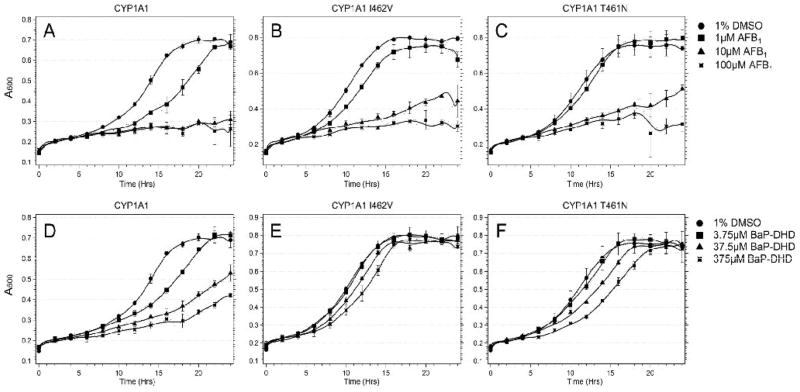
Figure 1.
Growth curves of the DNA repair rad4 rad51 mutant expressing CYP1A1 polymorphisms after exposure to BaP-DHD and AFB1. Approximately 105 cells were inoculated in each well in a 96-well plate platform; yeast growth in each well was monitored in a Tecan Plate reader and over a period of twenty-four hours. Absorbance (A600) is plotted against time (hrs). The columns include the rad4 rad51 strain (YB431) expressing CYP1A1 (Left), the rad4 rad51 strain (YB432) expressing CYP1A1 I462V, and the rad4 rad51 strain (YB433) expressing CYP1A1 T461N. The first row (panels A, B, C) is growth curves of cells from each strain after exposure DMSO or indicated doses of AFB1. The second row (panels D, E, F) is growth curves of cells after exposure to DMSO or BaP-DHD. Error bars represent standard deviation (SD), where N = 2.

