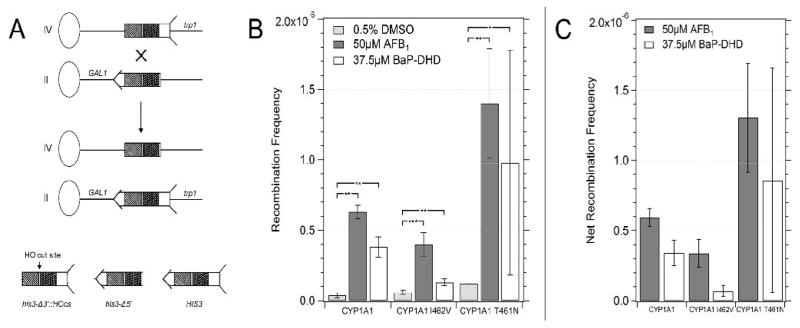
Figure 3.
Frequencies of AFB1-associated recombination in diploid cells expressing CYP1A1 (YB428), CYP1A1 I462V (YB429), CYP1A1 T461N (YB430). Figure in panel A is a model of the recombination assay. The oval represents a centromere and the line represents the chromosome; the left arm of the chromosome is not shown for simplicity. The his3 fragment is shown with arrow and feathers. The shaded areas represent shared homology. An ”X” denotes where a cross-over event would occur. The product of the recombination event is shown below where CEN2 is linked to the long arm of chromosome IV and CEN4 is linked to the long arm of chromosome II. Figure in panel B shows the recombination frequencies after cells were exposed to DMSO (solid column), 50 μM of AFB1 (horizontally striped column) and 37.5 μM of BaP-DHD (diagonally-striped column). Figure in panel C shows the net recombination frequencies, which are obtained by subtracting the spontaneous recombination frequency from the carcinogen-associated frequency. The CYP1A1 allele is indicated on the X axis. Error bars represent standard deviation (SD), N = 3.

