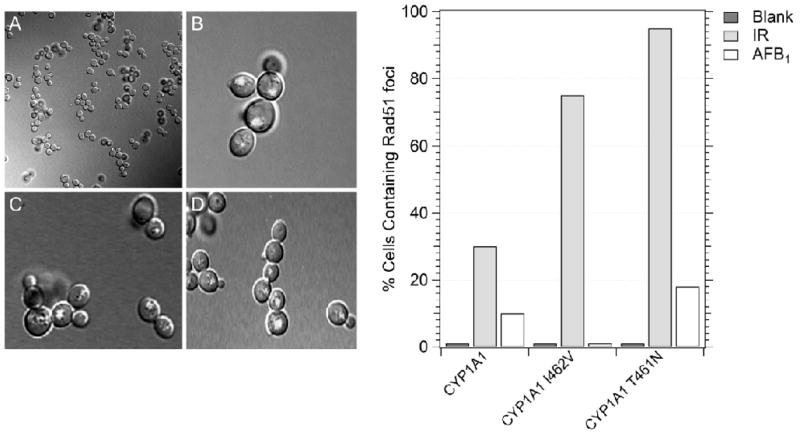
Figure 5.
Qualitative analysis of yfp-Rad51 foci in cells expressing CYP1A1 (YB434), CYP1A1 I462V (YB435), and CYP1A1 T461N (YB436). Rad51 foci were identified by the appearance of yellow fluorescent foci in the confocal microscope. Left panel shows A) non-irradiated cells containing pRS424-CYP1A1, B) Rad51 foci in AFB1-treated cells containing CYP1A1, C) Rad51 foci irradiated cells containing CYP1A1, D) Rad51 foci in AFB1-treated cells containing CYP1A1 T461N. The graph shows the percentage of CYP1A1-expressing cells containing Rad51 foci after either no exposure, exposure to AFB1 or 10 Gy irradiation. The percentage of cells containing foci is indicated on the y axis and the CYP1A1-expressing strain is identified on the X axis.

