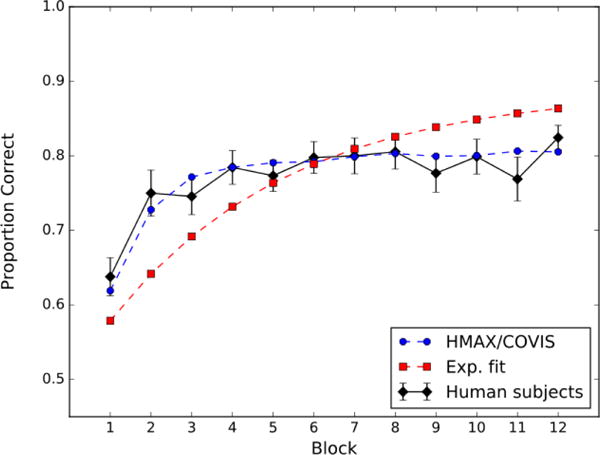
Figure 3.

Accuracy by block (50 trials) for the II task. The black curve denotes the data from the human participants, the broken blue curve denotes fits by HMAX/COVIS, and the broken red curve denotes fits by an exponential function (i.e., Equation 5).
