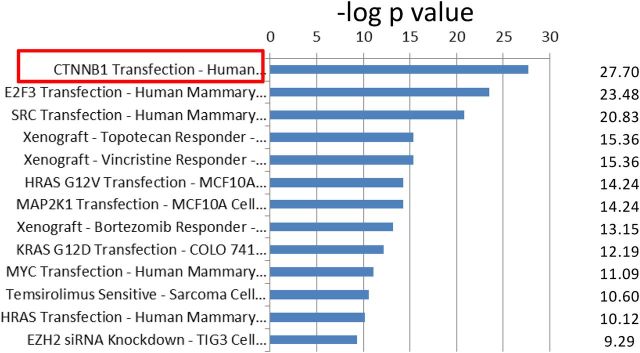
Figure 5.
Correlation of HWIDE signature with select gene sets in Oncomine database. The significant gene overlap is represented by −log of the P value. CTNNB1 transfection, outlined in red, has the most significant P value with a −log P value of 27.7. The complete concept datasets are shown in Supplemental Table 13.

