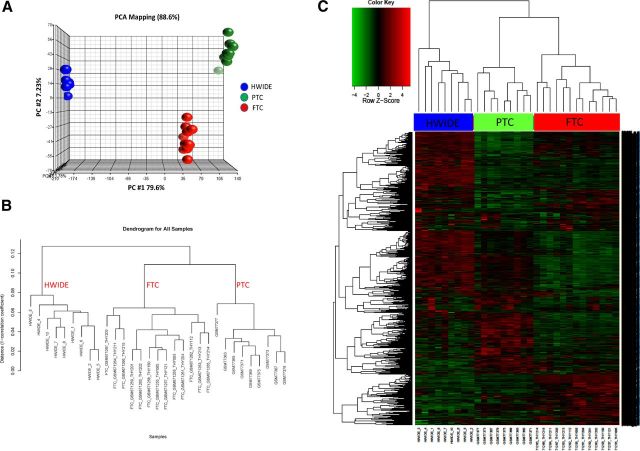
Figure 6.
A, Principal component analysis of expression data of HWIDE tumors compared with PTC and FTC from GEO (gene expression omnibus) using Partek Genomics Suite. B, Hierarchical clustering dendrogram of HWIDE expression profile compared with FTC and PTC samples. C, Heatmap showing differential gene expression between HWIDE expression profile compared with FTC and PTC samples from GEO. Tumors are arranged along the top and genes along the left.

