Figure 1.
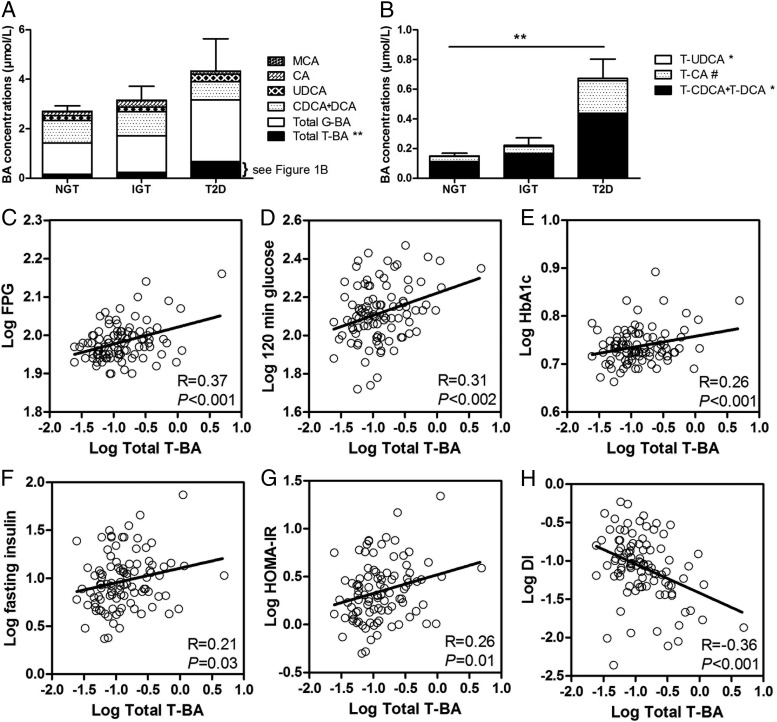
Fasting serum BA concentrations and glycemic metabolic measures. Total BA concentrations broken down into total T-BA, total G-BA, CDCA+DCA, UDCA, CA, and MCA (A) and total T-BA concentrations broken down into its subsets of T-CDCA+DCA, T-CA, and T-UDCA (B) in NGT, IGT, and T2D subjects. Error bars mark the standard error for total BA (A) and total T-BA (B). C–H, Univariate regression between total T-BA and fasting plasma glucose [95% confidence interval (CI) 0.022–0.066] (C), postload glucose (95% CI 0.045–0.188) (D), HbA1c (95% CI 0.006–0.041) (E), fasting insulin (95% CI 0.012–0.291) (F), HOMA-IR (95% CI 0.046–0.343) (G), and oral disposition index (95% CI −0.575 to −0.181) (H) (all variables were logarithmically transformed). DI, disposition index. *, P (ANOVA) < .05; **, P (ANOVA) < .01; #, P (ANOVA) = .054.

