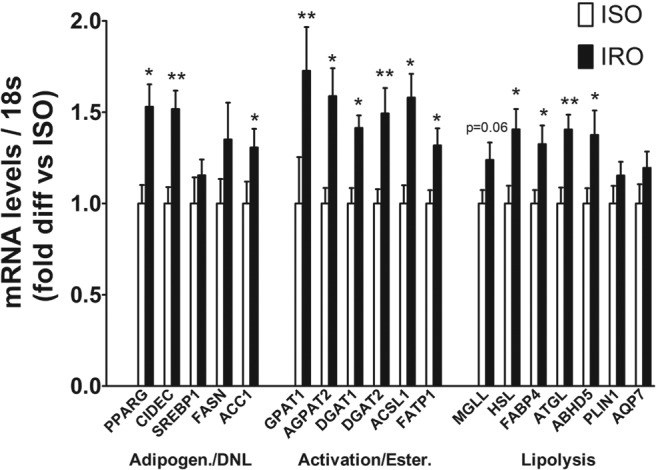
Figure 1. Increased mRNA expression of genes involved in glycerolipid-FA cycling in SAT of IRO subjects.

Fold difference in the mRNA levels of genes involved in various steps of glycerolipid-FA synthesis and lipolysis, in SAT of IRO relative to ISO subjects. Results are expressed as means ± SEM (n = 9–13 per group). DNL, de novo lipogenesis; Adipogen., adipogenesis; Ester., esterification. Significantly different from ISO: *, P < .05; **, P < .01.
