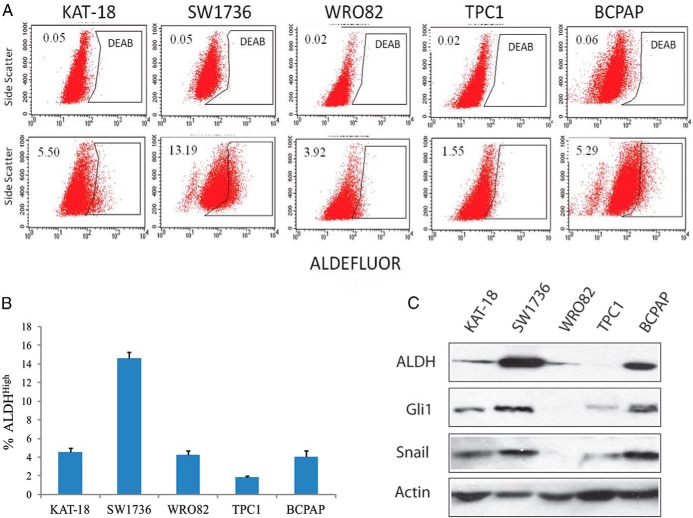
Figure 1. ALDH activity and expression in five thyroid tumor cell lines.
ALDH activity in KAT-18, WRO82, SW1736, TPC1, and BCPAP cells was analyzed by ALDEFLUOR (A). DEAB was added to each sample before staining as a background control. The number in each histogram denotes the percentage of ALDHHigh cells. The percentage of ALDHHigh cells in each cell line was plotted as the mean ± SD value from three independent experiments (B). Cell lysates were prepared from five thyroid tumor cell lines and analyzed by Western blot for the expression of ALDH, Gli1, Snail, and actin (C).

