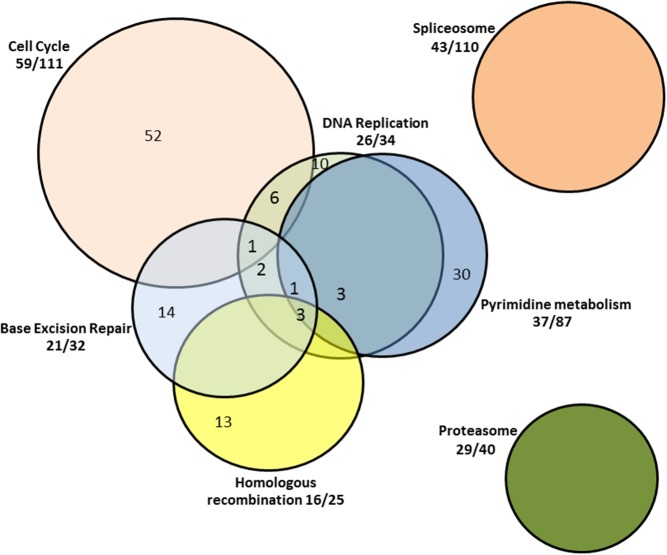
Figure 1. Pathways up-regulated by HG in monozygotic twins with T1D.
Fractions outside the Venn diagram represent the proportion of genes in a given pathway that are up-regulated by HG. Numbers within the Venn diagram reflect the numbers of genes up-regulated by HG exclusively within a given pathway and as included in more than one functionally interrelated pathway.

