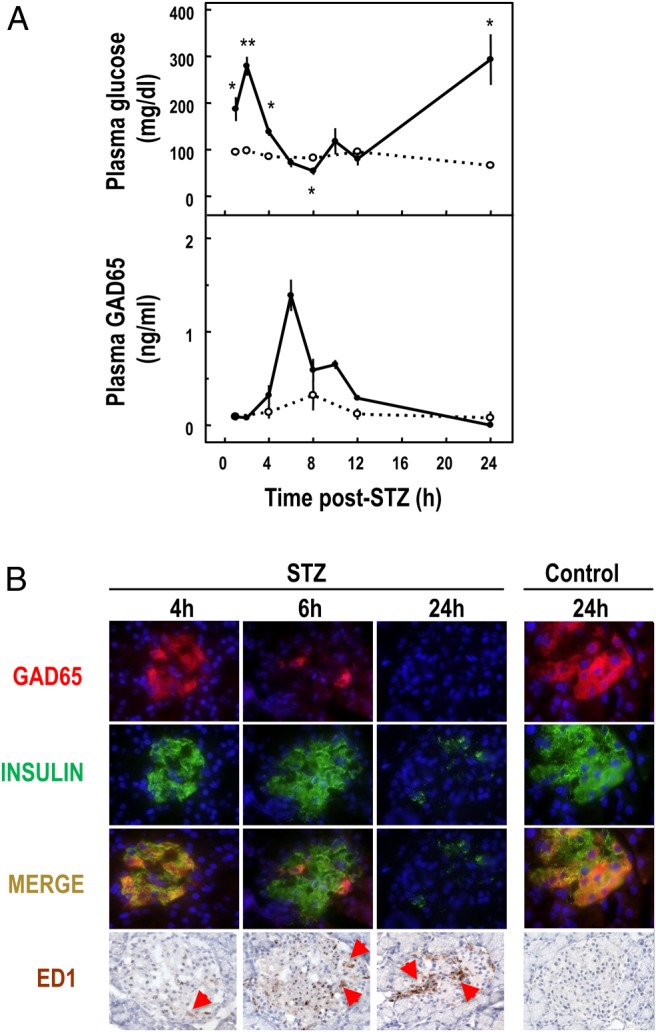
Figure 2. A, Plasma glucose and GAD65 concentrations in rats injected at time 0 with STZ (60 mg/kg body weight, full circles) or with solvent (open circles). Data represent mean ± SEM of three (control) or four (STZ) animals. Statistical significance of difference between control and STZ: *, P < .05, **, P < .01. B, Immunofluorescent double staining for GAD65 (red) and insulin (green) or immunostaining for macrophages (ED1, brown) on pancreatic sections of STZ-treated and control rats. Nuclei are stained with 4′,6′-diamino-2-phenylindole (blue) in fluorescence or hematoxylin.

