. 2017 Mar-Apr;25(2):147–158. doi: 10.1590/1678-77572016-0046

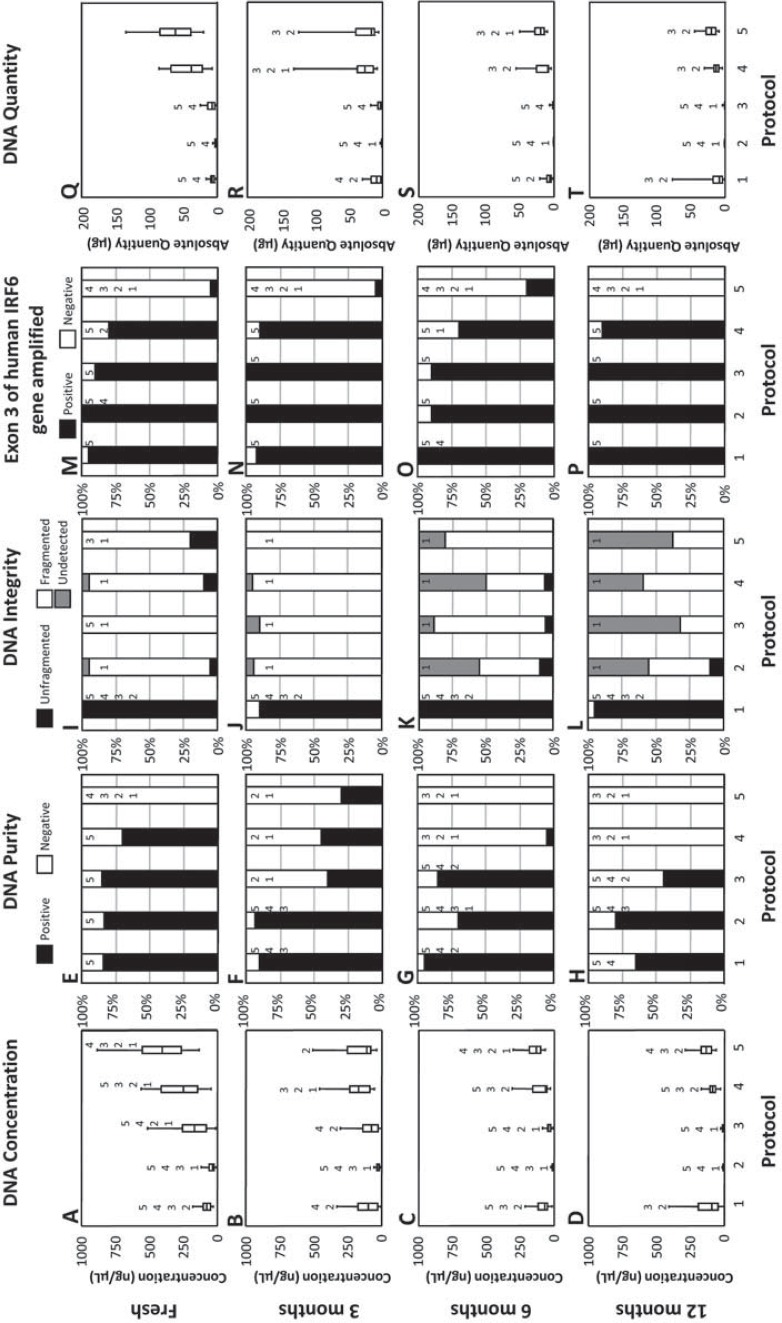
Figure 2. DNA quantity, purity, integrity and whether each sample contained amplifiable human DNA obtained from fresh saliva and saliva frozen at different time periods using five different extraction protocols. Protocol 1 (1) used the Oragene™ kit; protocol 2 (2) used the QIAamp® DNA Mini kit; protocol 3 (3) used ammonium acetate, protocol 4 (4) used the InstaGene™ Matrix kit; protocol 5 (5) used the InstaGene™ kit with proteinase K and 1% SDS. Quantity in terms of concentration (ng/µL) was assessed using spectrophotometry and reported using medians and their respective interquartile ranges. (A) DNA obtained by each of the 5 DNA extraction protocols from fresh saliva; (B) DNA obtained by each of the 5 DNA extraction protocols from saliva frozen for 3 months; (C) DNA obtained by each of the 5 DNA extraction protocols from saliva frozen for 6 months; (D) DNA obtained by each of the 5 DNA extraction protocols from saliva frozen for 12 months. Purity was assessed using spectrophotometry and expressed as a percentage of positive samples, absorbance ratio of A260/280 between 1.6 and 2.0 (black fill) or negative, outside the 1.6 to 2.0 range (white fill); (E) Samples from fresh saliva using each of the 5 DNA extraction protocols; (F) Samples from saliva frozen for 3 months using each of the 5 DNA extraction protocols; (G) Samples from saliva frozen for 6 months using each of the 5 DNA extraction protocols; (H) Samples from saliva frozen for 12 months using each of the 5 DNA extraction protocols. Integrity of DNA, visualized as a percentage of unfragmented (black fill), fragmented (white fill) or undetected (gray fill) DNA, as assessed using electrophoretic analysis; (I) Samples from fresh saliva using each of the 5 DNA extraction protocols; (J) Samples from saliva frozen for 3 months using each of the 5 DNA extraction protocols; (K) Samples from saliva frozen for 6 months using each of the 5 DNA extraction protocols; (L) Samples from saliva frozen for 12 months using each of the 5 DNA extraction protocols. Conventional PCR using primers specific for human DNA was used to amplify exon 3 of the interferon regulatory factor 6 (IRF6) gene in all samples at all time points investigated, and then visualized on an agarose gel; samples were either positive (black fill) or negative (white fill) for the presence of amplified human DNA; (M) Human DNA obtained by each of the 5 DNA extraction protocols from fresh saliva; (N) Human DNA obtained by each of the 5 DNA extraction protocols from saliva frozen for 3 months; (O) Human DNA obtained by each of the 5 DNA extraction protocols from saliva frozen for 6 months; (P) Human DNA obtained by each of the 5 DNA extraction protocols from saliva frozen for 12 months. Absolute quantity (µg) was assessed using spectrophotometry and reported using medians and their respective interquartile ranges; (Q) DNA obtained by each of the 5 DNA extraction protocols from fresh saliva; (R) DNA obtained by each of the 5 DNA extraction protocols from saliva frozen for 3 months; (S) DNA obtained by each of the 5 DNA extraction protocols from saliva frozen for 6 months; (T) DNA obtained by each of the 5 DNA extraction protocols from saliva frozen for 12 months. For each test at each time point, all protocols were tested overall (p-value <0.05, Kruskal-Wallis Test) and among one another for significant differences (p-value <0.05, Mann-Whitney U test). Numbers above box plots and columns indicate which protocols were significantly different from each protocol.

Figure 2