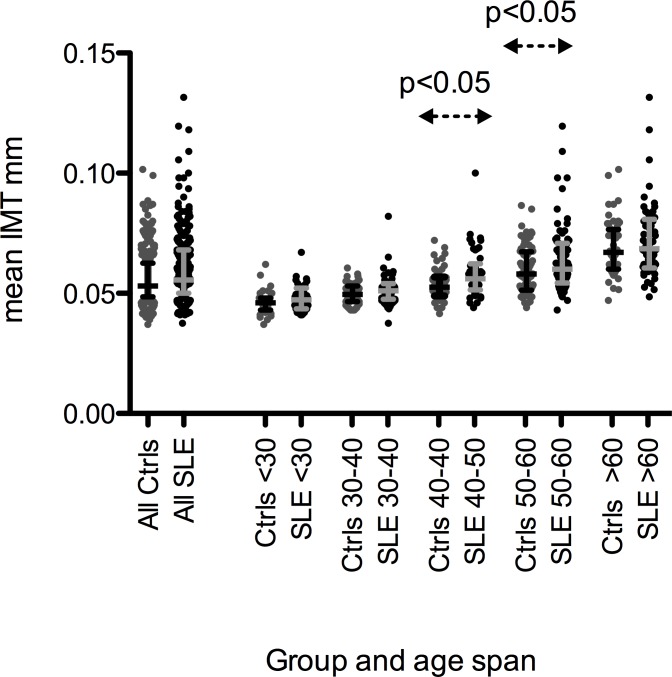
Fig 3. Mean IMT in controls and SLE patients, in all and stratified by age.
Scatter plots of the distribution of mean intima media thickness among SLE patients (black dots) and their respective age and gender matched controls (grey dots) per “age decade”. The difference between SLE patients and controls is significant in the age spans between 40–50 and 50–60 years, p<0.05 for both.

