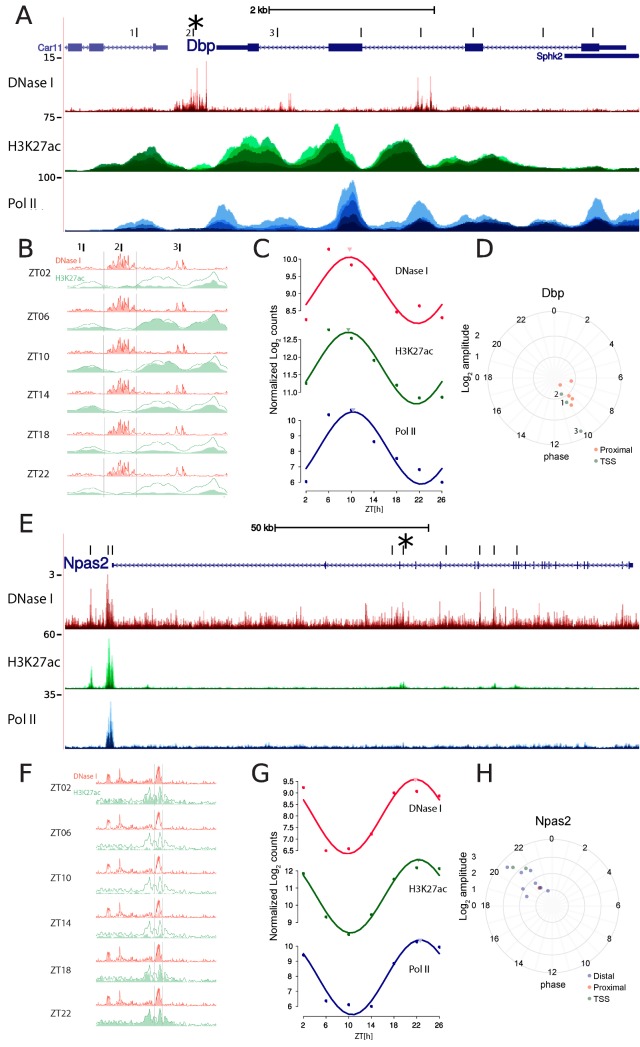
Fig 1. DNase I hypersensitivity is rhythmic during diurnal cycles in mouse liver.
A. DNase I hypersensitivity, RNA polymerase II (Pol II) density, and H3K27ac enrichment at the Dbp locus. The DNase I track shows the frequency at which nucleotide-resolved DNase I cuts, while H3K27ac and Pol II chromatin immunoprecipitation followed by DNA sequencing (ChIP-seq) signals are smoothed over 100 bp. All time points are overlaid. The center of each DNase I hypersensitive site (DHS)-enriched region is indicated by vertical ticks (three sites near the TSS are numbered). B. Zoom-in around the transcription start site (TSS) of Dbp (the three TSSs in A are marked) reveals DNase I cuts in between H3K27ac-marked nucleosomes. Both DNase I and H3K27ac signals are maximal at ZT6–ZT10 and minimal at ZT22, consistent with BMAL1-mediated activation of Dbp transcription (absolute signal is highest for site 2, while amplitude is highest for site 3; see panel D). The red and green lines (identical in all subgraphs) show the max signal over the time points at each position and serve as a guide to the eye. C. Quantification of read counts (in log2 units) for DNase I cuts (in windows of ±300 bp) and Pol II and H3K27Ac ChIP-seq data (in windows of ±1,000 bp) centered on the Dbp TSS using cosine fits. Cosine fits show a common estimated peak time around ZT10 (marked by the inverted triangles). Peak-to-trough amplitudes are about 16-fold for Pol II and approximately 4-fold for both DNase I and H3K27ac. D. Phases and amplitudes of all DHS sites located in the neighborhood of the Dbp gene (nearest TSS association according to annotation). Distances from the center of the plot indicate fitted log2 amplitudes, and angles (clockwise from ZT0) indicate peak times. We observed that all regions oscillate around a common phase of ZT10. Of the three sites near the TSS (numbered 1–3), site 3 has the highest amplitude. E–H. Idem as A–D but for Npas2, which has an opposite phase to Dbp (i.e., Npas2 peaks near ZT22). Oscillatory amplitudes are generally larger for Npas2 compared to Dbp. G shows quantification of the signal at the TSS as in panel C.

