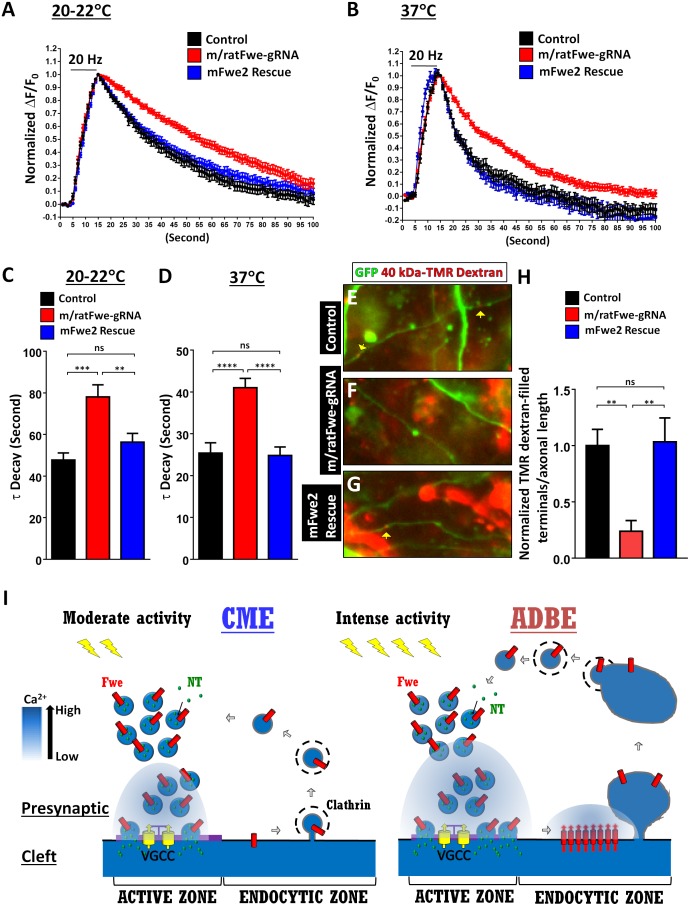
Fig 7. Knockout of ratFwe2 impairs Clathrin-Mediated Endocytosis (CME) and Activity-Dependent Bulk Endocytosis (ADBE) in cultured rat hippocampal neurons.
(A–D) The time-course traces for Synaptophysin-pHluorin (SypHy) fluorescence in the presynaptic terminals of DIV13–15 cultured rat hippocampal neurons. DIV7 neurons were transfected with pSpCas9(BB)-2A-tagRFP and pCMV-SyphyA4 (black line), pSpCas9(BB)-m/ratFwe-gRNA-2A-tagRFP and pCMV-SyphyA4 (red line), or pSpCas9(BB)-m/ratFwe-gRNA-2A-tagRFP-2A-mFwe2-HA and pCMV-SyphyA4 (blue line). They were subjected to a train of 200 action potentials evoked at 20 Hz. The SypHy images were captured at room temperatures (20–22°C) and physiological temperatures (37°C). ratFwe knockout neurons display slow SypHy retrieval via synaptic vesicle (SV) endocytosis when compared to controls and mFwe2-rescued neurons. The average retrieval rates (τ) of SypHy are shown in C–D. Presynaptic terminals (20–22°C: control, n = 31; m/ratFwe-gRNA, n = 40; and mFwe2 rescue, n = 51. 37°C: control, n = 21; m/ratFwe-gRNA, n = 30; and mFwe2 rescue, n = 27) labeled with both tagRFP and SypHy derived from ≥5 coverslip cultures were analyzed. (E–G) DIV13–15 cultured rat hippocampal neurons were imaged after a train stimulation with 1,600 action potentials evoked at 80 Hz in the presence of 40 kDa tetramethylrhodamine (TMR)-dextran dye (red). The neurons were transfected with pSpCas9(BB)-2A-GFP (control, E), pSpCas9(BB)-m/ratFwe-gRNA-2A-GFP (m/ratFwe-gRNA, F), or pSpCas9(BB)-m/ratFwe-gRNA-2A-GFP-2A-mFwe2-HA (mFwe2 rescue, G) plasmid. In the axons marked with green fluorescent protein (GFP) expression, the presynaptic terminals filled with dextran dye are indicated by yellow arrows. (H) The number of dextran-filled presynaptic terminals per axonal length was quantified. The values shown in H are normalized to the average value of controls. The dextran uptake via ADBE is severely impeded in ratFwe knockout neurons, which is normalized by mFwe2 expression. Axons (control, n = 14; m/ratFwe-gRNA, n = 14; and mFwe2 rescue, n = 12) derived from ≥3 coverslip cultures were analyzed. The images were taken at the same scale. p-Value: ns, not significant; **, p < 0.01; ***, p < 0.01; ****, p < 0.001. Error bars indicate the standard error of the mean. (I) A proposed model for different roles of Fwe in CME and ADBE. The underlying data can be found in S1 Data.

