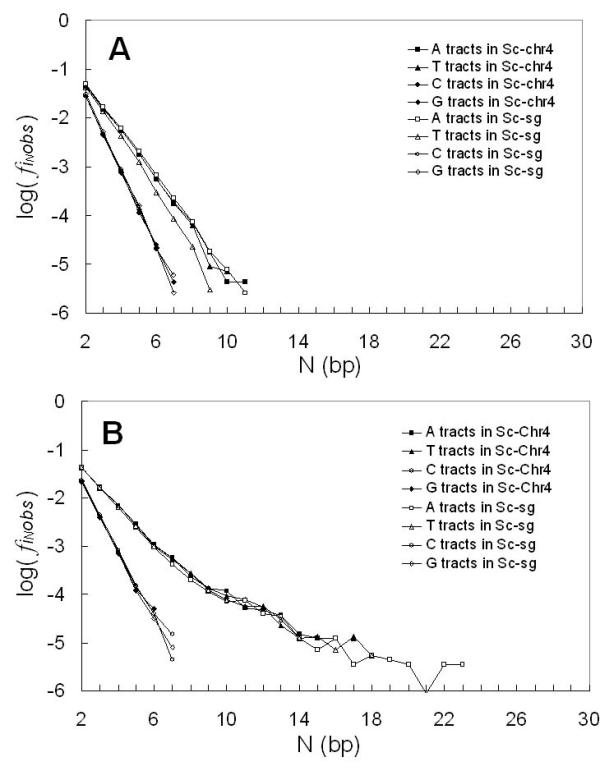
Figure 2.

Comparison of the four tract frequencies from Sc chromosome 4 sequences and Sc single gene sequences as a function of N, the tract length, calculated from: A. coding sequences; B. non-coding sequences. In the legend, "sg" represents "single gene" and "chr" represents "chromosome".
