Figure 8.

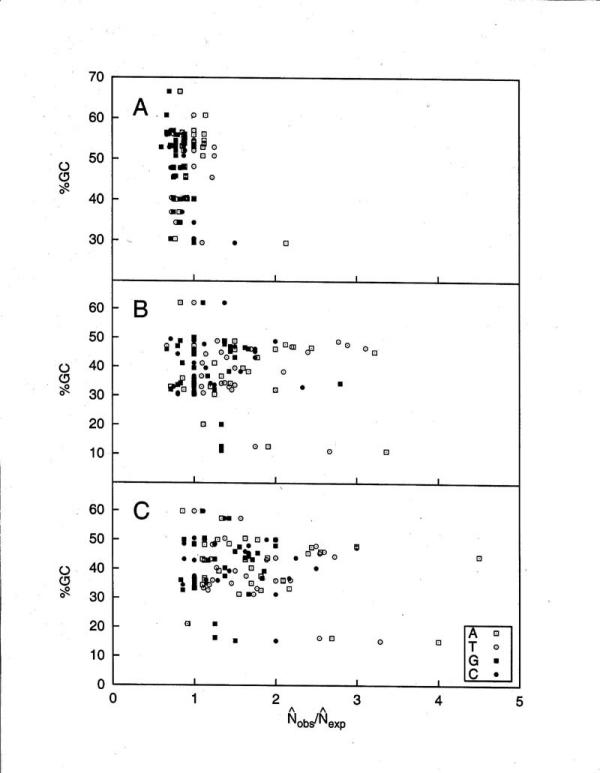
The relationship of the (G+C)% of the DNA analyzed to the calculated  /
/  (P) for all the sequences of 27 organisms A. coding; B. intron; C. flanking.

The relationship of the (G+C)% of the DNA analyzed to the calculated  /
/  (P) for all the sequences of 27 organisms A. coding; B. intron; C. flanking.