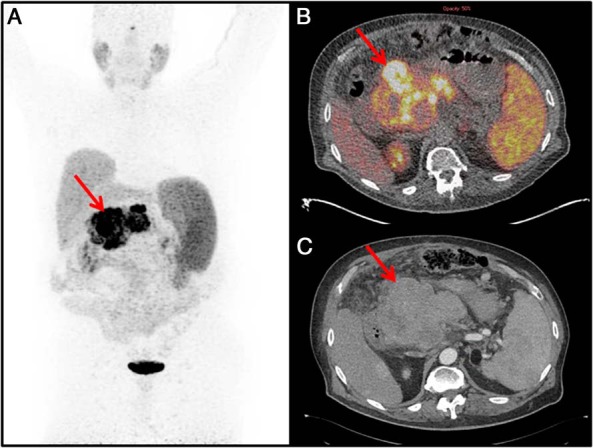
Figure 3. Imaging studies of the pancreatic NET.

A, 68Ga-DOTATATE PET maximal intensity projection image showing a large central lesion in the abdomen (red arrow). B, 68Ga-DOTATATE PET/CT image showing the pancreatic head mass with a maximum standardized uptake value of 58 (red arrow). C, Arterial phase CT showing corresponding mass (red arrow).
