. 2016 Sep 20;101(11):3879–3883. doi: 10.1210/jc.2016-2751

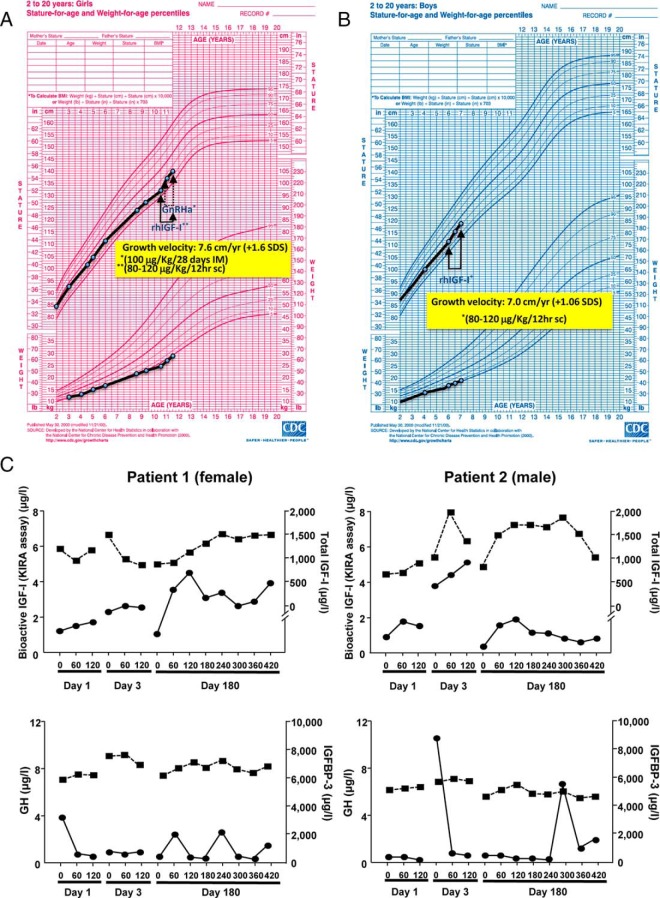
Figure 1. A, Growth chart of the female patient with PAPP-A2 deficiency, representing the pattern of growth before and after rhIGF-1 therapy with a dose between 40 and 120 μg/kg every 12 hours. B, Growth chart of the male patient with PAPP-A2 deficiency, representing the pattern of growth before and after rhIGF-1 therapy with a dose between 40 and 120 μg/kg every 12 hours. C, The top graphs represent changes in bioactive IGF-1 as measured by kinase receptor activation (dark circles and continuous line) and total IGF-1 (dark squares and dashed lines) in response to treatment. The bottom graphs represent changes in GH secretion (dark circles and continuous line) and IGFBP-3 (dark squares and dashed line) in response to treatment.

Figure 1.