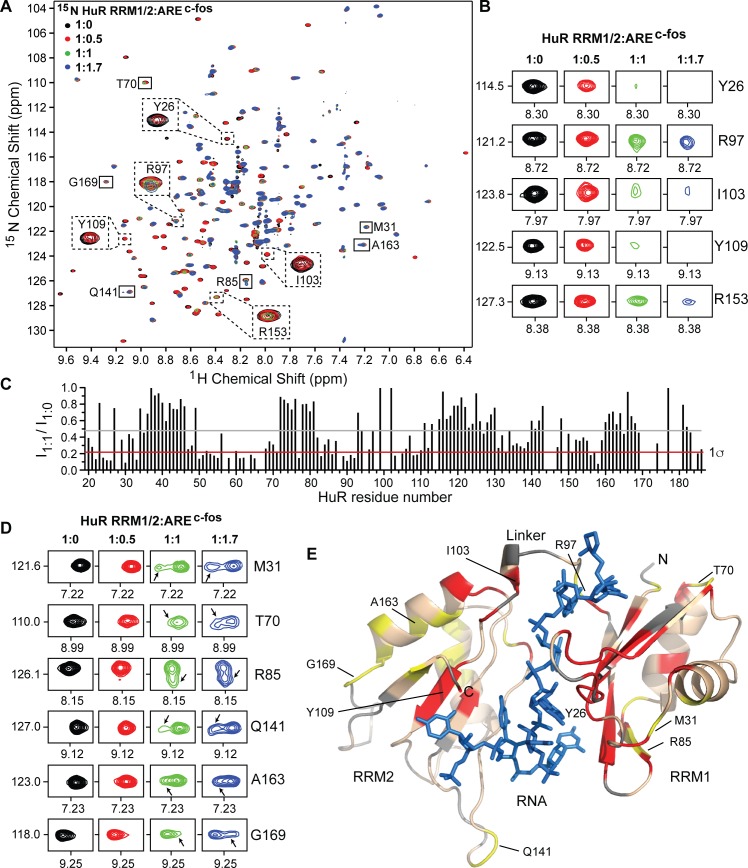
Fig 2. NMR titrations of 15N-labeled HuR RRM1/2 with AREc-fos.
(A) Overlay of four 2D 1H-15N TROSY spectra of 15N HuR RRM1/2 titrated with increasing molar ratios of AREc-fos RNA. Representative residues showing peak broadening (dashed box) and residues displaying changes in peak positions (solid box) are shown. (B) Representative residues displaying peak broadening upon RNA binding are shown at similar contour level at individual titration points. (C) Plot of relative peak intensity for all non-overlapping HuR RRM1/2 resonances in the ligand bound versus free state (I1:1 /I1:0). Gray and red lines correspond to the mean and one standard deviation from the mean (1σ), respectively. (D) Representative residues that displayed changes in peak positions are shown at similar contour level at individual titration points. While the original peak (RNA-free form) gradually decreases in intensity, a new peak (shown by arrow) appears and progressively gains intensity with increasing concentrations of RNA. (E) Results of NMR titrations mapped onto the co-crystal structure of HuR-AREc-fos complex (PDB 4ED5) and colored as follows: RRM1/2 residues with peak intensity ratio (I1:1 /I1:0) lower than 1σ (red), residues with new peaks shown in D (yellow), unassigned residues (gray), and RNA (blue).

