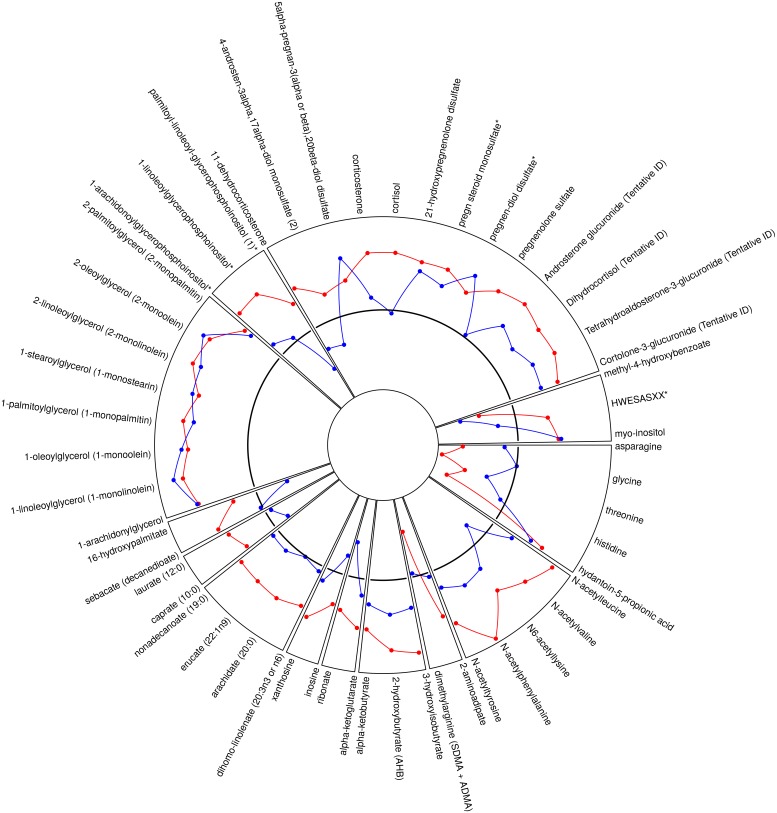
Fig 2. Radar plot of all identified metabolites that demonstrated a significant mean intra-subject temporal change between acute (T0, enrollment prior to cardiac catheterization) and quiescent state in thrombotic MI that is distinct from the pattern of change observed in non-thrombotic MI or stable CAD.
The black solid line represents change in stable CAD subjects, red illustrates change in thrombotic MI, and blue illustrates change in non-thrombotic MI. Values above indicate positive change and values below indicate negative change relative to change observed in stable CAD. The radar plot shows 65 metabolites.

