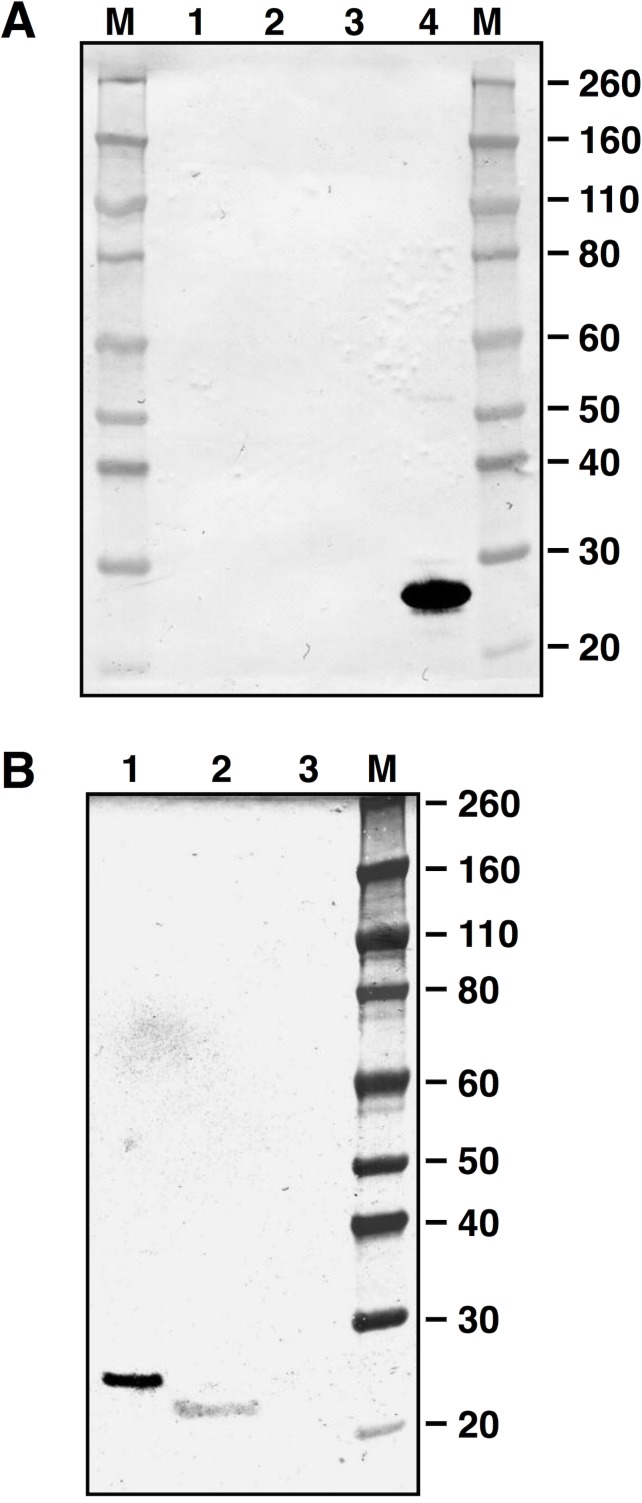
Fig 6. LytB sub-cellular localization.
Membranes were incubated with an anti-LytB specific serum raised in mice. Numbers on the sides indicate the molecular mass marker (M) expressed in KDa. (A) Lane 1, cell wall; lane 2 envelope; lane 3 cytoplasm; lane 4, 1 μg of recLytB. Fractions loaded in each well corresponds to 1 × 10¹⁰ cell equivalents. (B) Lane 1, 0.2 μg of recLytB; lane 2, culture supernatant of V288; lane 3, culture supernatant of ΔlytB mutant GP1485.

