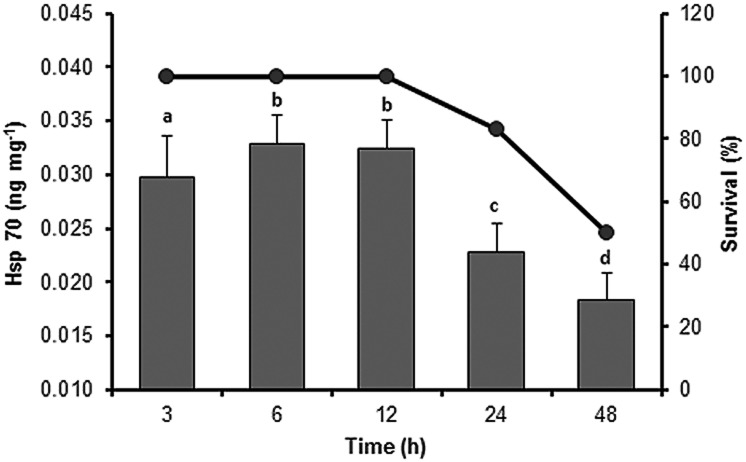
Fig 2. Expression of heat shock protein 70 (hsp70) from the sea cucumber Isostichopus badionotus in response to sublethal thermal tolerance.
Line represents percentage survival; columns represent mean ±SE; n = 12 (factorial ANOVA; Tukey’s HSD, P < 0.05). Different letters represent significant differences between the exposure times.

