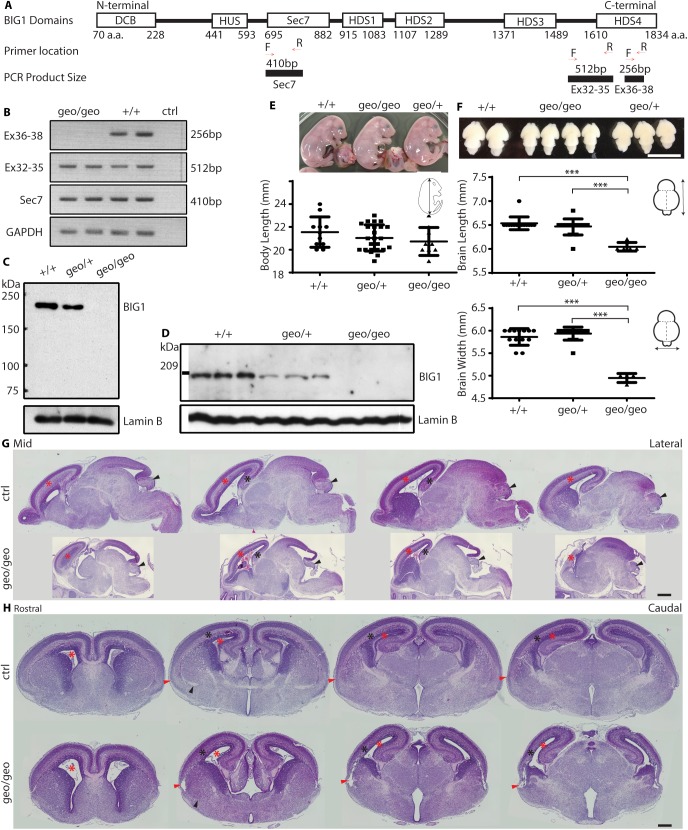
Fig 1. Genetic and morphological analyses of BIG1 gene-trap mice.
(A) The forward (F) and reverse (R) PCR primers flanking the Sec7 domain, exons 32–35 and exons 36–38 of BIG1 cDNA were used for PCR. The expected PCR product sizes are shown. The cDNA regions corresponding to respective domains in BIG1 protein are shown and labeled. (B) Representative electrophoresis gel images of PCR products (n = 2 per group). (C-D) The western blot was performed using E17.5 brain lysate and detected using antibody targeting BIG1 based on an (C) N-terminal epitope (n = 3 brains per group) or (D) C-terminal epitope, using Lamin B as loading control. (E) The length of E17.5 embryos among the three genotypes is statistically similar. Arfgef 1+/+ vs Arfgef1geo/geo, p = 0.08; Arfgef1geo/+ vs Arfgef1geo/geo, p = 0.14. Scale bars, 10 mm. Arfgef 1+/+, n = 11; Arfgef1geo/+, n = 24; Arfgef1geo/geo, n = 9. (F) At E17.5, the length and width of brains in Arfgef1geo/geo mice are statistically smaller than Arfgef1geo/+ and Arfgef 1+/+ mice. Length, Arfgef 1+/+ vs Arfgef1geo/geo, ***p = 9.20E-07; Arfgef1geo/+ vs Arfgef1geo/geo, ***p = 4.07E-06. Width, Arfgef 1+/+ vs Arfgef1geo/geo, ***p = 2.15E-10; Arfgef1geo/+ vs Arfgef1geo/geo, ***p = 1.36E-10. Scale bars, 5 mm. Arfgef 1+/+, n = 13; Arfgef1geo/+, n = 14; Arfgef1geo/geo, n = 4. (G) HE-stained sagittal sections shows differences in the neocortex (red asterisks), hippocampus (black asterisks) and cerebellum (black arrowheads) between Arfgef1geo/geo brains and controls. Scale bars, 500 μm. n = 3 per group. (H) HE-stained coronal sections showing differences in the neocortex (black asterisks), lateral ventricles (red asterisks), piriform cortex (red arrowheads) and external capsule (black arrowheads). Scale bars, 500 μm. n = 3 per group. For all quantifications, Student’s T-test was used for comparisons between groups. Data are shown as the mean ± SD.

