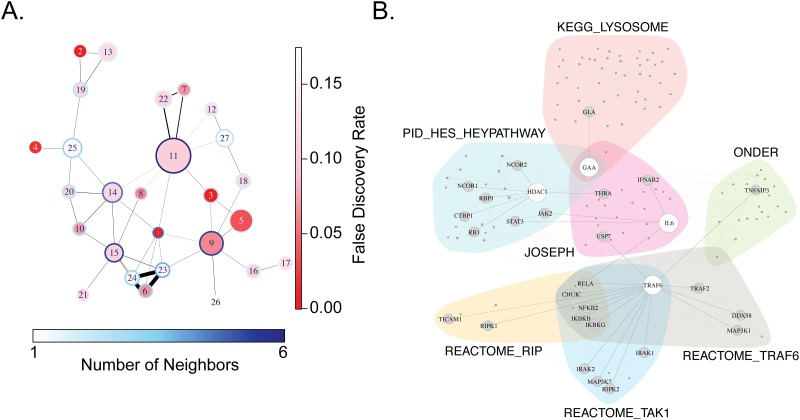
Fig 2. Network analysis of gene sets unique to cases demonstrating resistance to M.tb infection.
(A) A network diagram was generated from the results of GSEA listed in Table 2 with a FDR < 20%. In this network, each node corresponds to a gene set (pathway); an edge is drawn between two gene sets with a black line if the genes in the two gene sets overlap. Here, the diameter of each node corresponds to the relative number of genes in each gene set; the degree of blue color shading in the perimeter of each node represents the number of its neighbors (number of gene sets whose members overlap); the degree of central red color shading reflects significance (FDR value); and the thickness of each edge corresponds to the number of genes shared by the two neighboring gene sets (proportional to the Jaccard Index between pathways). Gene set 1 is ‘JOSEPH_RESPONSE_TO_SODIUM_BUTYRATE.’ (B) Venn diagram centered on the ‘JOSEPH’ gene set and its 6 neighboring gene sets in diagram. Each shaded area corresponds to a gene set, and edges between pairs of genes correspond to gene-gene interactions defined in KEGG, obtained using the ‘graphite’ R-package. Genes present in the gene set but absent from the KEGG database are not shown for clarity. The location of HDAC1, GAA, TRAF6, and IL-6 are highlighted along with their neighbors.

