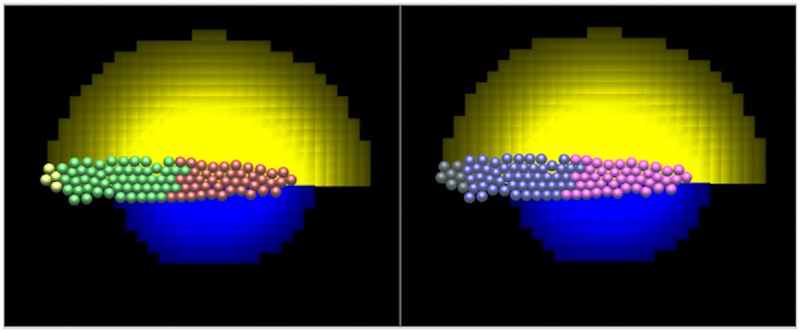
Fig 3. Illustration of the simulations using the 3D deformable ellipsoid cell-based model.
View from above of a 1-cell layer representing the PLLP. The stripe of CXCL12a would be directly underneath the PLLP, not explicitly shown. For visualization purposes, the Wnt (blue) and FGF (yellow) ligands are shown as a pair of clouds in each split-image. Left panel: cells are colored based on receptor expression level (red for high Wnt and green for high FGF receptor levels, WR, FR). FGFR and WntR expressing cells are colored yellow. Right panel: cells colored by their bound receptor levels (pink for high Wnt and purple for high FGF bound-receptor levels, WB, FB). In our model we interpret the latter as the Wnt or FGF signalling levels. Cells in the back of the PLLP express FGF receptors but do not signal since FGF ligand is so low that most FGF receptors are unbound. Grey or yellow cells at the back of the PLLP are those that are not yet committed to being either WntR or FGFR active cells. Results from the full 3D model after 30 min of simulation time (before the onset of migration).

