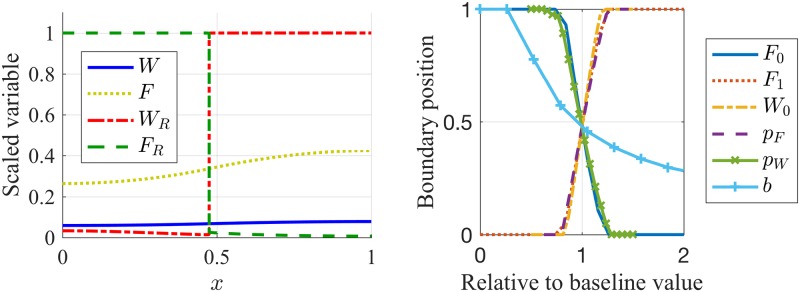
Fig 6. The position of the boundary between leading and trailing zones is parameter dependent.
In the left panel, the concentration profiles of the ligand and receptor activity are plotted at t = 25 minutes (after formation of signalling domains), which reveals the formation of a sharp boundary between the leading and trailing zones. In the right panel, the boundary position between the leading and trailing zones is shown to be a function of model parameters. Parameter sweeps were conducted for a range of “IC50” inhibition parameters F0, W0, FGF steady state receptor levels F1, production of Wnt and FGF ligand pW, pF, as well as the slope of the W1 gradient across the PLLP, b. The vertical axis represents the fraction of the PLLP length that is FGF-receptor expressing at steady state. The horizontal axis represents the given parameters, scaled by their baseline values as listed in Table A in Supporting Information S6 Text. Parameter Estimation and Values.

