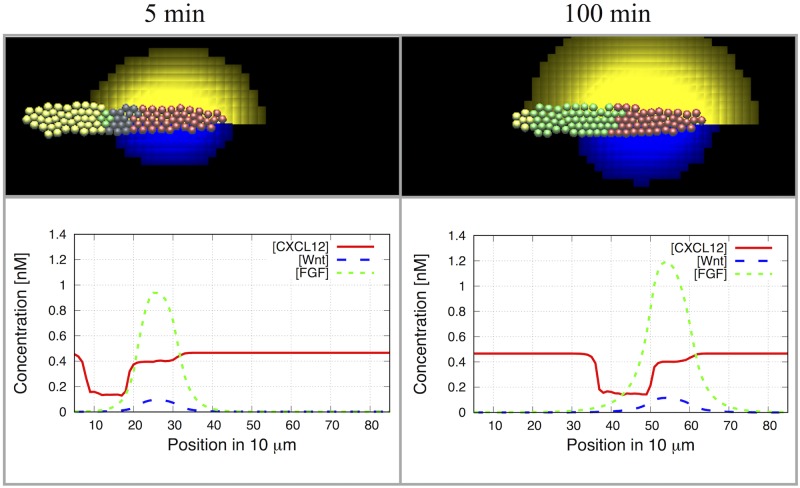
Fig 9. Successful migration in the discrete cell model.
Simulations of the migrating primordium showing WntR expressing cells (red), FGFR expressing cells (green), WntR and FGFR expressing cells (yellow) and indeterminate cells (grey). Left: at 2 min, Right: at 100 min. Bottom row: concentrations of CXCL12a (red), FGF (green) and Wnt (blue). Parameters as in Table A in Supporting Information S6 Text. Parameter Estimation and Values. See Fig. C in Supporting Information S5 Text. Additional results and details, for a more detailed time sequence and Supporting Information S1 Movie. 3D simulation of PLLP migration, for a 4 hour movie of the simulation results.

