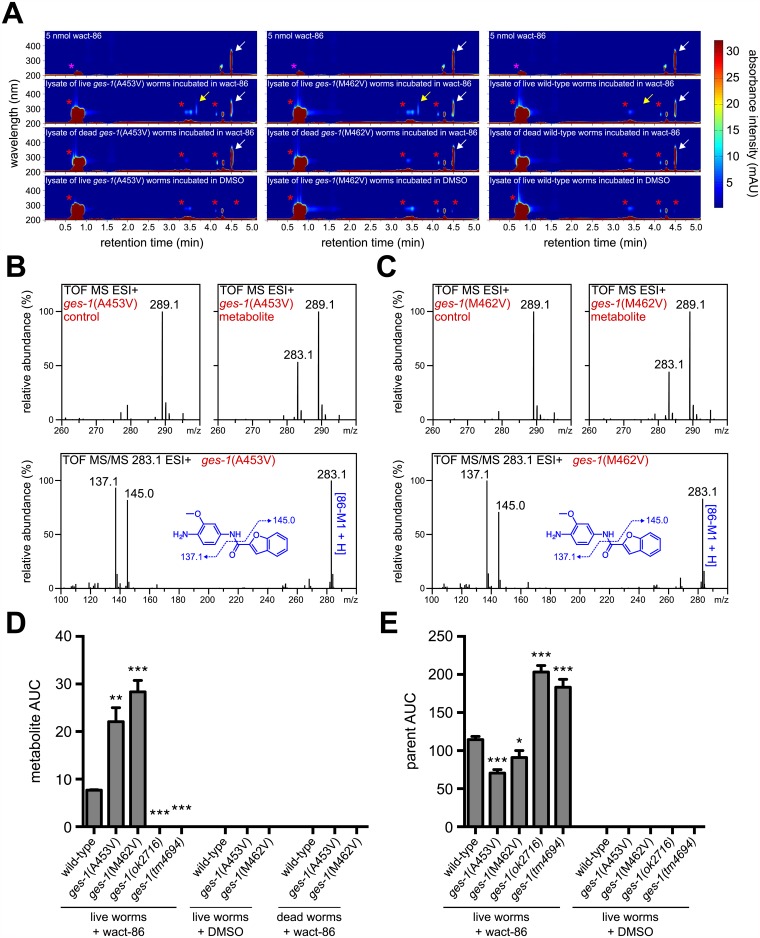
Fig 3. Wact-86-resistant mutants have increased GES-1-dependent hydrolysis of wact-86.
(A) HPLC analysis of wact-86 metabolism for the indicated genotypes. HPLC-DAD chromatograms for the lysates of live worms incubated in DMSO alone, the lysates of live and dead worms incubated in wact-86, and 5 nmol of wact-86 stock compound are shown. The magenta asterisks indicate the DMSO peak, the red asterisks indicate the peaks of endogenous worm metabolites, the white arrow indicates the wact-86 parent structure peak, and the yellow arrow indicates the presumptive wact-86 metabolite peak. The peak that elutes at ~4.3 minutes in all of the chromatograms is a background instrument peak. (B and C) Mass spectral data for the DMSO control and metabolite fractions collected from the lysates of worms with the indicated genotypes, as well as tandem MS/MS fragmentation spectra for the 283.1 mass found exclusively in the metabolite fractions (see S1 Table for accurate mass data). (D and E) Quantification of wact-86 metabolite (D) and parent structure (E) accumulation in worms incubated in 30 μM wact-86. The genotypes are indicated. ok2716 and tm4694 are deletion alleles of ges-1. For control purposes, quantification was also performed for worms incubated in DMSO alone, as well as for dead worms incubated in wact-86, where appropriate. Area under the curve (AUC) was calculated at a wavelength of 290 nm and a retention time of 3.7 minutes for the metabolite. For the wact-86 parent structure, AUC was calculated at a wavelength of 316 nm and a retention time of 4.5 minutes. One, two, and three asterisks indicate student’s t-test p < 0.05, p < 0.01, and p < 0.001, respectively, compared to wild-type. Error bars represent the s.e.m.

