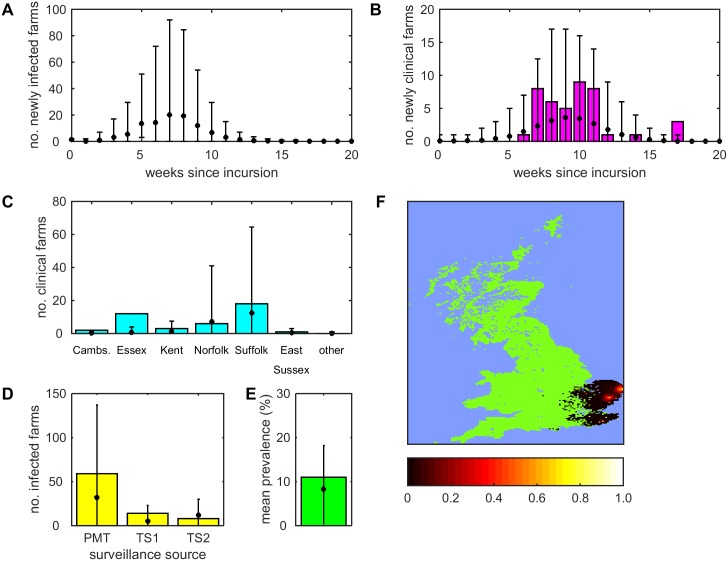
Fig 1. Observed and predicted spread of bluetongue virus serotype 8 in Great Britain in 2007 for the model in which vector dispersal is described by a diffusion process.
(A, B) Number of (A) newly infected farms and (B) farms with newly confirmed clinical cases each week. (C) Cumulative number of farms with confirmed clinical cases in each county. The six named counties are those for which there were confirmed clinical cases. (D) Number of infected farms detected by pre-movement testing (PMT) or targeted surveillance around the first two affected farms in Suffolk (TS1 and TS2). (E) Within-farm prevalence for cattle herds. Each plot shows the observed values (bars) and mean (circles) and 95% prediction intervals for the simulations. (F) Predicted spatial spread of BTV-8 in GB. The map shows the cumulative probability of infection (see scale bar) expressed as the proportion of simulated outbreaks for which at least one farm was affected by BTV within each 5 km grid square. Results are based on 100 replicates of the model with parameters sampled from the joint posterior distribution.

