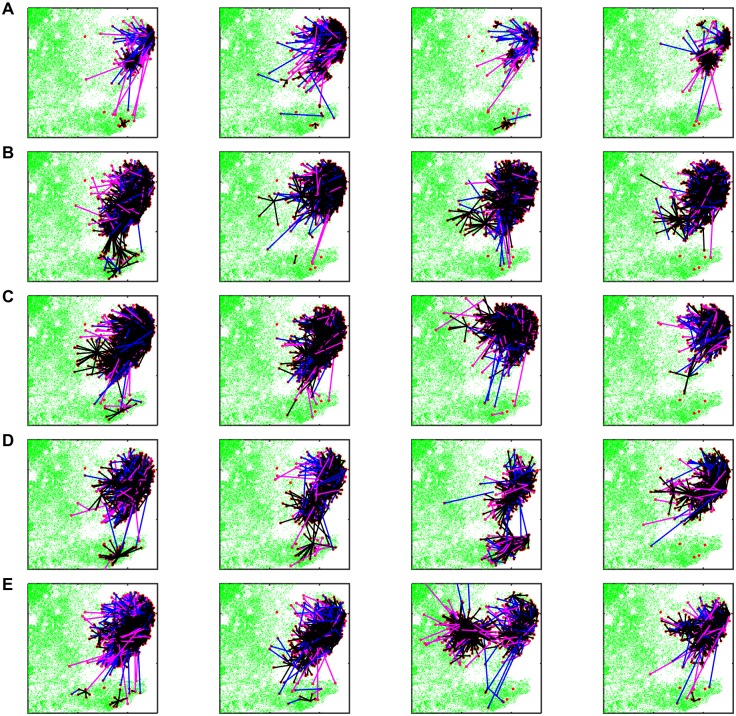
Fig 3. Transmission routes in simulated outbreaks of bluetongue virus in 2007 in Great Britain.
Maps show transmission routes assuming different models for vector dispersal: (A) diffusion; (B) exponential kernel; (C) Gaussian kernel; (D) fat-tailed kernel; or (E) stepped kernel. In each plot uninfected farms are shown as green dots and infected farms are shown as red dots. Unconnected red dots are seed farms which did not infect other farms. Lines indicate transmission via dispersal of infected vectors (black), movement of infected cattle (blue) or movement of infected sheep (magenta). Results are presented for four selected replicates of the each model with parameters sampled from the joint posterior distribution.

