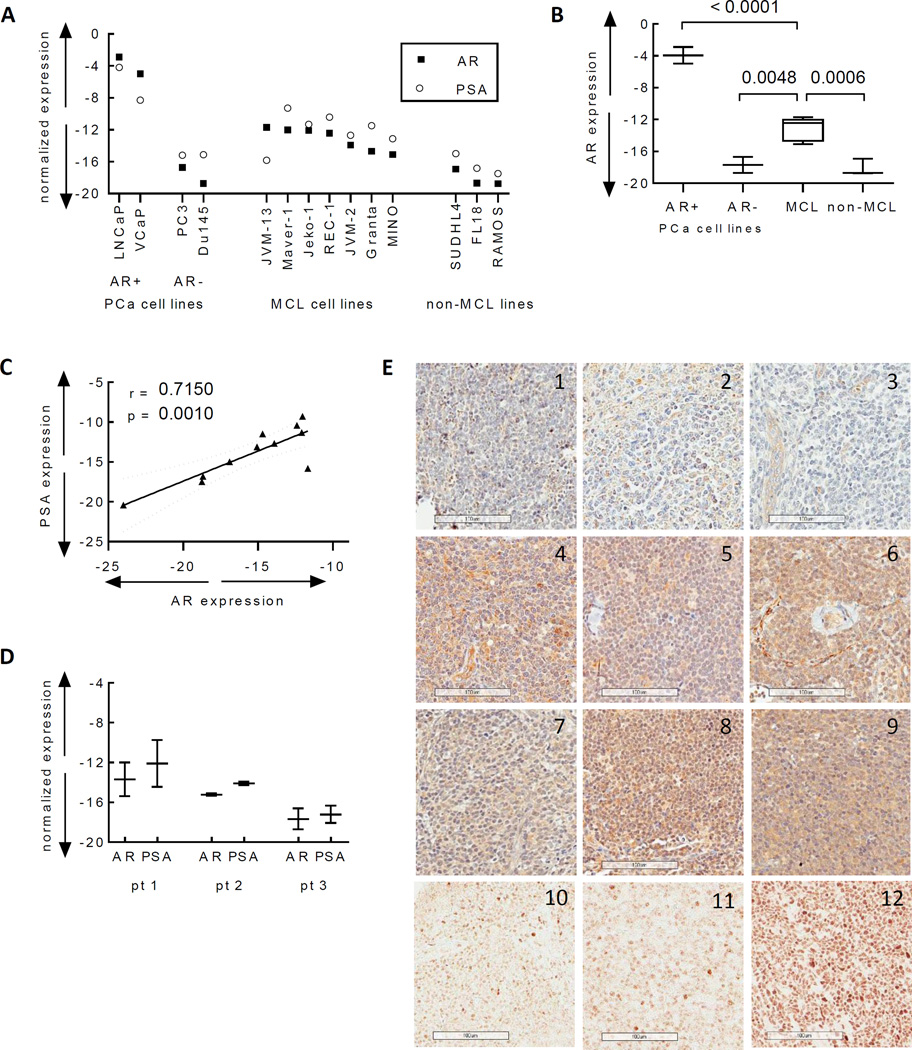
Figure 1. Expression of the androgen receptor (AR) in MCL cell lines and tumors.
(A) Transcript expression of AR and the androgen-regulated gene PSA were measured by quantitative RT-PCR in each of the indicated prostate cancer (PCa), MCL, and non-MCL lymphoma cell lines (SUDHL4 (DLBCL), FL18 (follicular), and Ramos (Burkitt’s)). Data are represented as the difference in cycle thresholds (dCT) of AR or PSA vs the housekeeping gene RPL13A. (B) Box and whisker plot of the median AR expression in the AR positive and AR negative PCa cells compared to the MCL and non-MCL lymphoma cell lines. Horizontal lines indicate median values; white boxes denote the 75th (upper margin) and 25th percentiles (lower margin). Upper and lower bars indicate minimum and maximum values, respectively. Unpaired t tests were used to assess significance. (C) Spearman rank correlation between transcript levels of AR and PSA in the MCL and non-MCL lymphoma cell lines. (D) Box and whisker plot of the median AR and PSA expression in frozen tumor cells from three MCL patients. (E) Expression of AR by IHC in formalin fixed tumor biopsies from male and female (cases 1, 3 and 9) MCL patients. Samples 10–12 were stained without the hematoxylin counterstain to better appreciate nuclear staining. Images acquired with an Aperio Scanscope AT Turbo microscope using a Basler L301KC camera at 20× magnification (resolution 0.50 um/pixel). Scale bar = 100um.

