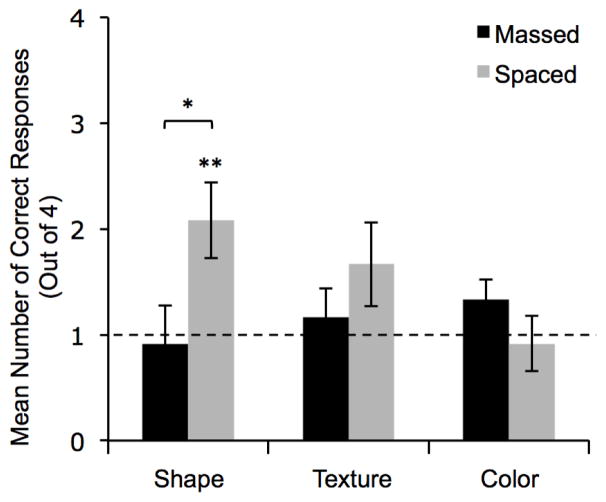
Figure 2.
Mean number of correct responses by category type for each of the two presentation timing conditions. Error bars indicate standard errors of the mean. The dashed line represents chance performance (one out of four correct). Asterisks indicate statistical significance between conditions (specified by the bracket) or compared to chance, at the .05 (single asterisk) or .01 (two asterisks) level.

