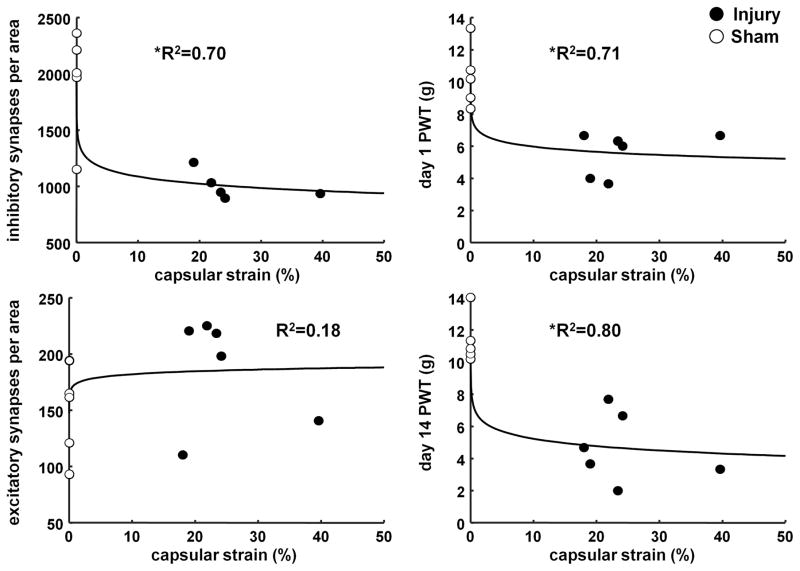
Figure 4.
Correlations between the mean maximum principal strain (MPS) and the inhibitory and excitatory synapse density at day 14, as well as the paw withdrawal threshold (PWT) at each of day 1 and 14. The logarithmic regression fit with inhibitory synapse density at day 14 (p=0.0025), PWT at day 1 (p=0.0011), and PWT at day 14 (p=0.0002) are all significant. The coefficient of determination (R2) for those correlations shows a very good goodness of fit. Yet, excitatory synapse density at day 14 is not significantly correlated with MPS (p=0.19) and has a low R2.

