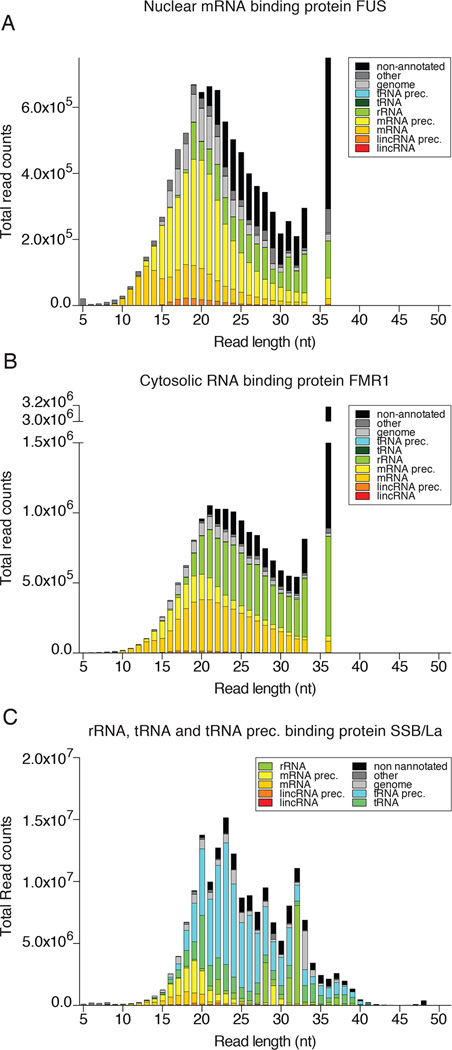
Fig. 5.
Graphic presentation of the PAR-CLIP cDNA library composition by RNA categories for A) FUS, B) FMR1, and C) SSB/La. Stacked bar graphs represent the number of reads mapping to each RNA category with up to 2 mismatches resolved by length of adapter-extracted sequence reads. Categories of less than 0.01% of reads were grouped and depicted as “other”.

