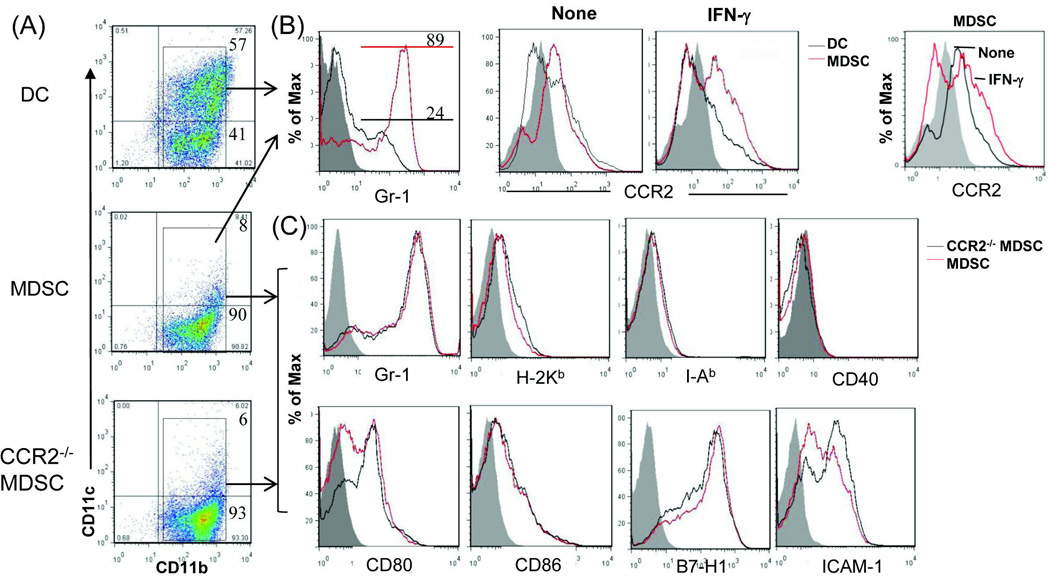
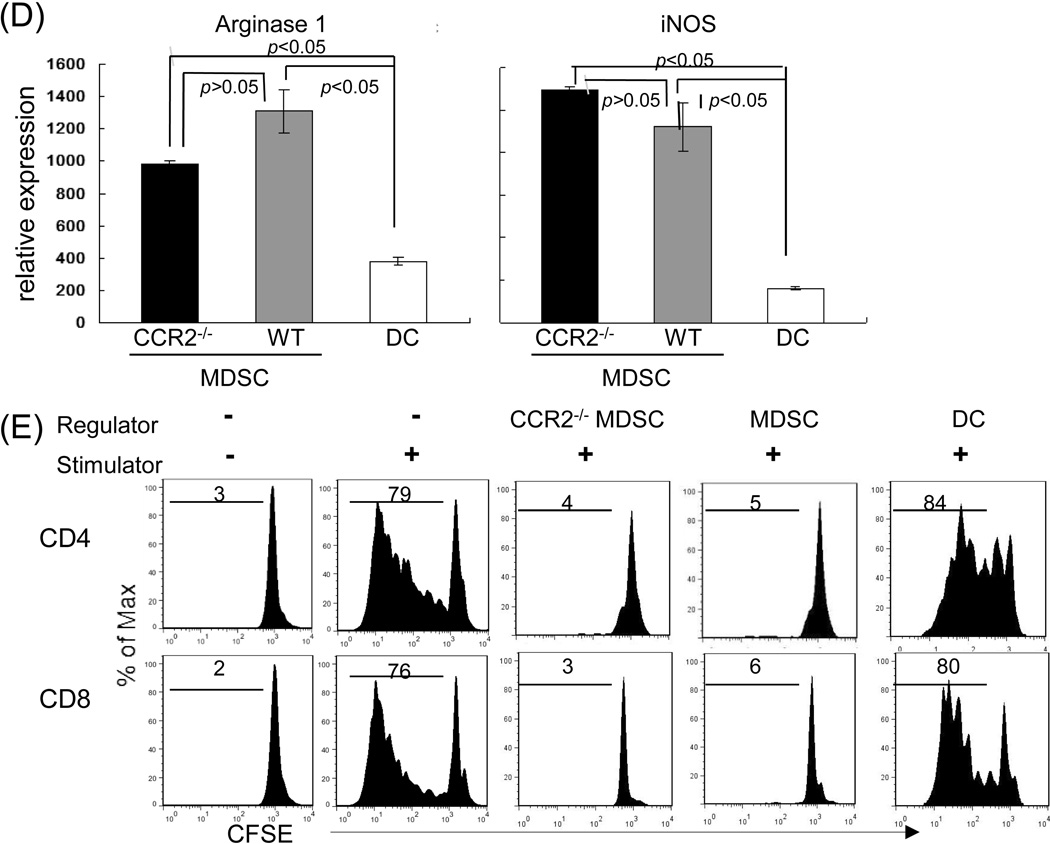
Figure 1. Deficiency in CCR2 expression does not alter MDSC phenotype and immunosuppressive activity in vitro.
The MDSC used in this study were generated in vitro by addition of HpSC (B6) at the beginning into the culture of BM cells that were isolated from WT or CCR2−/− B6 mice at a ratio of 1:50 in the presence of GM-CSF and IL-4 for 5 days. The floating cells were harvested. The BM cells cultured in the absence of served as controls (DC). Cells were stained for CD11b, CD11c and the indicated key surface molecules, and analyzed by flow cytometry. (A) Expression of CD11b and CD11c on DC, MDSC and CCR2−/− MDSC. The number is percentage of positive cells in whole cell populations. (B) Expression of Gr-1 and CCR2 on DC and MDSC. MDSC expressed high Gr-1 (left panel). For IFN-γ stimulation, the cells were exposed to IFN-γ (100U/ml) for last 18 hours of the cultures. Right panel shows an overlay of CCR2 expression on MDSC with or without exposure to IFN-γ. All data are displayed as histograms gated on CD11b+ populations. (C) Null of CCR2 expression in MDSC does not affect expression of the key surface molecules. Expression of the indicated molecules was analyzed on WT and CCR2−/− MDSC. The data are displayed as histograms gated on CD11b+ cells. (D) Deficiency in expression of CCR2 does not alter expression of arginase-1 and iNOS in MDSC. RNA was isolated from the magnetic beads purified CD11b+ cells. Expression of mRNA was determined by q-PCR, displayed as mean (n=3) relative expression ± SD, and analyzed by two-way t test with Bonferroni correction. (E) CCR2−/− MDSC demonstrate comparable T cell inhibitory activity in vitro. DC and MDSC generated from WT or CCR2−/− mice (B6) were used as regulators, and added into a 3-day MLR culture in which allogeneic T cells (BALB/c) were elicited by B6 DC as stimulators (T:DC = 20:1). T cell proliferation was determined by CFSE dilution assay, and expressed as histograms gated on CD4 and CD8 populations. The number is percentage of dividing CD4+ or CD8+ T cells. The data are representative of three separate experiments.


