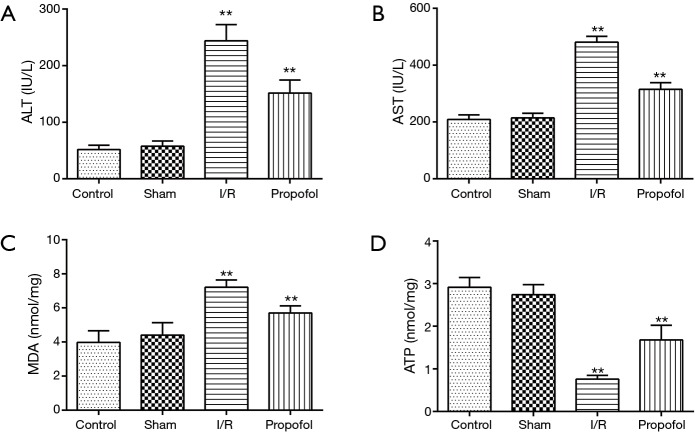
Figure 1.
The ALT (A), AST (B), MDA (C) and ATP (D) levels in liver tissues in four groups. Data were presented as mean ± SD (**P<0.01). The significance of I/R group was compared with control/sham group while the significance of propofol group was compared with I/R group. ALT, alanine aminotransferase; AST, aspartate aminotransferase; MDA, malondialdehyde; ATP, adenosine triphosphate; I/R, ischemia-reperfusion.

