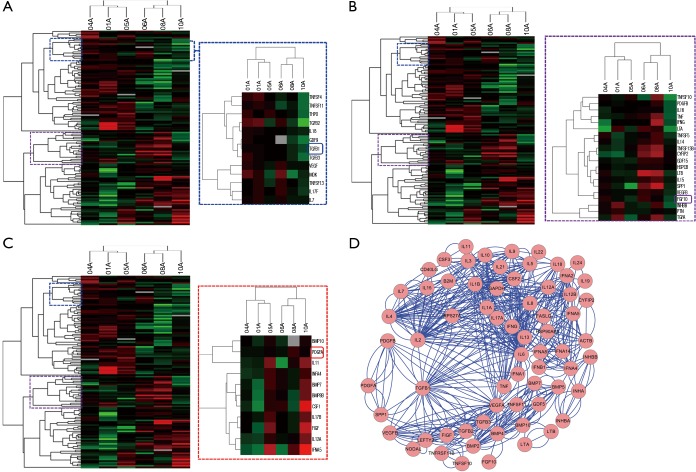
Figure 1.
The hierarchical clustering and network analysis of cytokines microarray in IIPs patients. (A-C) The hierarchical clustering of 127 cytokines in patients were analyzed by cluster 3.0 and displayed by the software Java TreeView. Cytokines are color-coded according to their inheritance status (IPF: n=3, INSIP: n=3); (D) the network map of cytokines tightly involved in advancement of patients with IPF and INSIP. IIP, idiopathic interstitial pneumonia; IPF, idiopathic pulmonary fibrosis; INSIP, idiopathic nonspecific interstitial pneumonia.

