
Fig. 4.
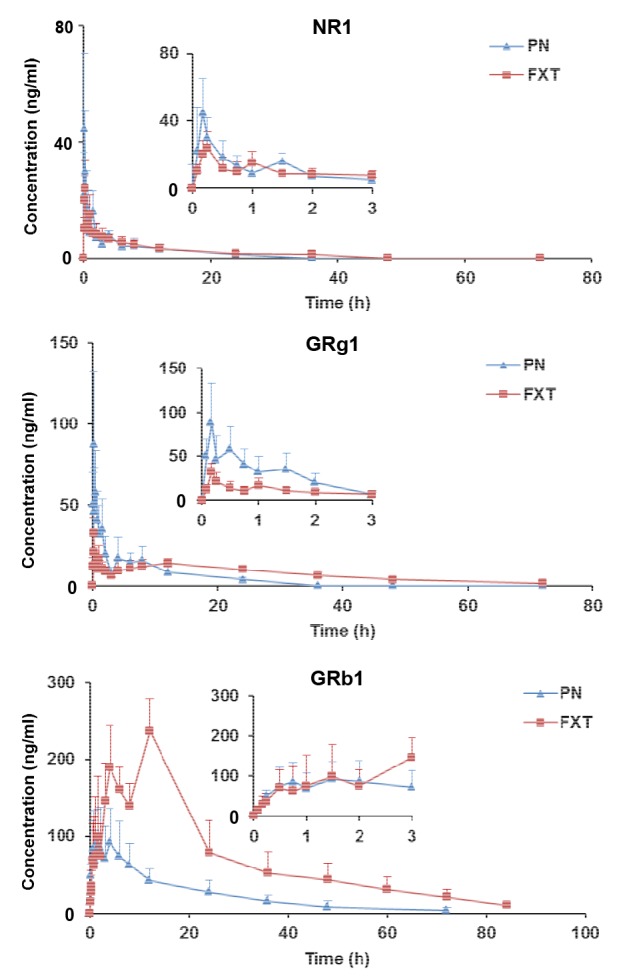
Mean concentration-time profiles of NR1, GRg1, and GRb1 in rat plasma after oral administrations of PN and FXT
Partial enlarged drawings of 0–3 h are shown in each image. Date are expressed as mean±SD (n=6)
Official websites use .gov
A
.gov website belongs to an official
government organization in the United States.
Secure .gov websites use HTTPS
A lock (
) or https:// means you've safely
connected to the .gov website. Share sensitive
information only on official, secure websites.
Mean concentration-time profiles of NR1, GRg1, and GRb1 in rat plasma after oral administrations of PN and FXT
Partial enlarged drawings of 0–3 h are shown in each image. Date are expressed as mean±SD (n=6)